Data-related Frequently Asked Questions
Information about how to access the data, data adjustment practices, and more
GO-BGC data can be used freely, with no restrictions. However, we ask that GO-BGC is properly acknowledged when used in a publication or a product.
Float data can be accessed in various formats through multiple data portals
Data FAQ
How to access BGC-Argo Data
GDAC
What is a Sprof file?
The primary data resource in the Argo system for BGC users is the merged Sprof data files. Each Sprof file contains data from all profiles for a single float in netCDF format (nnnnnnn_Sprof.nc where nnnnnnn is the 7 digit WMO number of each float). In the Argo system, physical and biogeochemical variables are generally held in separate files per profile. The separated variables maintain an interface consistent with Argo history for users of the much larger core (physical) dataset. Conversely, the Sprof files merge and align all of the physical and biogeochemical state variables (temperature, salinity, oxygen concentration, pH, nitrate concentration, chlorophyll concentration, optical backscatter and downwelling irradiance) along a common pressure axis in each profile.
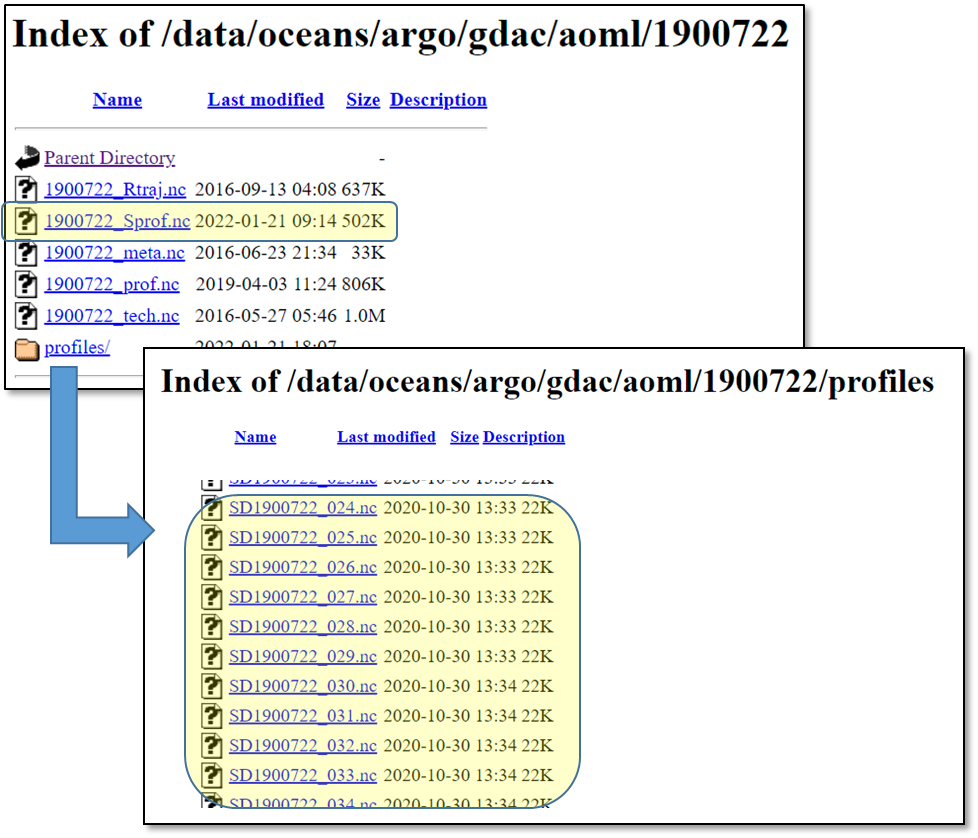
How do I find BGC Argo data in the GDAC?
A master index file maintained at each of the Argo Global Data Assembly Centers contains a list of all BGC float profiles, the state variables available, and their location in the data repository (https://www.usgodae.org/ftp/outgoing/argo/argo_synthetic-profile_index.txt or https://data-argo.ifremer.fr/argo_synthetic-profile_index.txt). The index file points to the “profiles” sub-directory for each float and lists each available Sprof profile file. Each float’s merged Sprof file, containing all of its profile data, is found in the parent directory of the “profiles” subdirectory.
For the following index file (with header line above):
File, date, latitude, longitude, ocean, profiler_type, institution, parameters, parameter_data_mode, date_update
aoml/1900722/profiles/SD1900722_001.nc,20061022021624,-40.316,73.389,I,846,AO,PRES TEMP PSAL DOXY,DDDD,20201030133005
the merged Sprof file with all profiles at the USGODAE GDAC would be found at https://usgodae.org/ftp/outgoing/argo/dac/aoml/1900722/1900722_Sprof.nc
The DDDD notation tells you the status of each variable (R=Raw, D=Delayed mode adjusted, A=Adjusted in real time). In the example line, there are 4 variables PRES TEMP PSAL DOXY
with a notation DDDD. All of the variables in this profile have been adjusted in Delayed mode. In particular, the oxygen in this float (DOXY) is D mode – it has been corrected in Delayed mode.
What do the Argo data modes R, D, and A mean and which should I use for science projects?
Within the Sprof files, users will find the real-time (R mode) and adjusted (A or D mode) data for each state variable along with quality flags for each measurement. For each adjusted variable, there is an estimate of the measurement error. We stress that users should only use adjusted (A or D mode) data, as the BGC sensors regularly require a significant adjustment to their calibration after deployment. Users must read the quality flags that accompany each observation to ensure that only data characterized as good by the float operator is used (Argo Flag = 1 which indicates good data, or Argo Flag = 8, which indicates good data interpolated slightly to match the pressure level of other variables; Table 1). The adjusted variables are identified as PARAMETER_ADJUSTED in the data files. E.g., DOXY_ADJUSTED for dissolved oxygen.
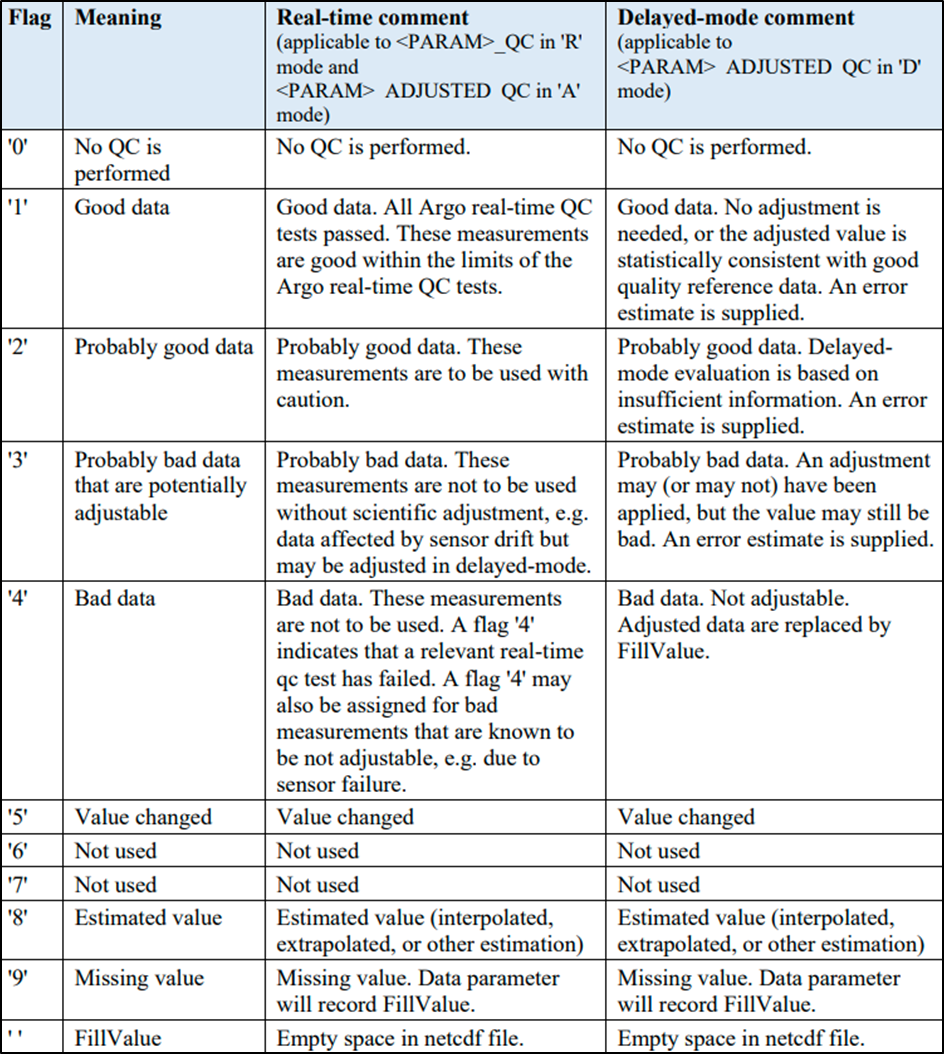
What are the Argo data quality flags?
Every observation in the Argo data system has a data quality flag associated with it. Quality flags for R mode and A mode data are assigned by algorithms following a variety of numerical tests. Quality flags for D mode data also include visual inspection of the data by a human operator to ensure that proper assignment of the flags are made. This table defines the quality flags used in the Argo system:
How often is the BGC-Argo dataset updated? Does the Argo dataset have a DOI?
The Argo dataset, including BGC-Argo, is updated daily as new float profiles arrive. Further, new algorithms may be applied to improve the quality of data at undefined intervals. If this is done, the entire dataset may be reprocessed with some change in values. If a fixed version of the dataset is desired, a user should access the monthly archived versions of the Argo data, complete with a digital object identifier (DOI) at http://www.argodatamgt.org/Access-to-data/Argo-DOI-Digital-Object-Identifier. The archived snapshots will not change and the DOI for each monthly snapshot provides a traceable reference to the dataset. These snapshots contain the Sprof files that are described in the FAQ “What is a Sprof file?”, as well as all core Argo data. The monthly snapshots are large, ~45 Gbytes, therefore. The monthly archives will not be updated with any improvements or new Argo profiles. If the latest and most accurate data is required, the user should access the Sprof files as described in the Sprof FAQ.
Data Access Tools
Are there data access tools for BGC Argo data?
Yes! A handy quiver of tools to access and visualize Argo data in Matlab, Python & R can be found at: https://biogeochemical-argo.org/data-tools.php. Video tutorials on how to use this toolbox can be found here.
Are there data access tools for educators?
Adopt-a-Float: We partner with teachers and classrooms across the country to inspire and educate students about global ocean biogeochemistry and climate change. This program creates a powerful opportunity for students to engage directly with scientists and learn about their research by naming and tracking BGC (biogeochemical) floats.
More resources for educators can be found on our Outreach page.
BGC Data Adjustments
Is there a journal article to cite for BGC data adjustment?
Yes. Please refer to Johnson et al. 2017 (https://doi.org/10.1002/2017JC012838), and Maurer et al. 2021 (https://doi.org/10.3389/fmars.2021.683207).
How are pH and nitrate data adjusted?
Drift or offsets in the sensor calibration are corrected during quality control of the data by comparing reported nitrate or pH at depths below 1000 m with values predicted from algorithms fitted to high quality hydrographic data (primarily GLODAP) using temperature, salinity, pressure, oxygen, and position (Maurer et al., 2021). Low pass filtered drifts or large offsets determined at depth are applied as a constant to each concentration observed on a profile. Note that unadjusted NITRATE or PH_IN_SITU_TOTAL data in their raw state are not recommended for scientific use. Users are advised to always look for the NITRATE_ADJUSTED (A or D mode) variable within Argo data files.
How are oxygen data adjusted?
While optodes are shown to be stable once deployed, it is well documented that the sensor calibration may drift low prior to deployment while exposed to air (termed storage drift). This drift occurs as a multiplicative change on all oxygen concentrations, thus a gain correction is applied to correct for this drift (see refs for details). The necessary gain correction is generally determined when the float reaches the sea surface and makes a measurement of oxygen in air. This allows the gain correction to be determined from the known atmospheric oxygen partial pressure and then applied to the data. Raw DOXY dataReal-time unadjusted data (R mode) are uncorrected for the gain, while DOXY_ADJUSTED data (A or D mode) Adjusted and Delayed Mode data are corrected. We stress that all users use DOXY_ADJUSTED data Adjusted or Delayed Mode data for DOXY, as raw DOXY Real-time data will be biased low. If air oxygen is not measured, the Adjusted and Delayed Mode data are corrected by other methods described in the Argo quality control manual (Thierry et al., 2021).
How are chlorophyll data adjusted?
To account for a calibration bias, the factory-calibration derived CHLA is corrected down by a factor of two, based on the global average correction value reported in Roessler et al. (2017). This adjusted value is reported as CHLA_ADJUSTED. However, it should be noted that this correction is imperfect. The appropriate correction factor has a geographic trend, and the correction could range from 0.5 to 12. Therefore, depending on the study region, the CHLA_ADJUSTED can still potentially be biased by a factor of 3 or more. In addition to the calibration correction, chlorophyll fluorescence measured in daylight is often suppressed by a process known as non-photochemical quenching (NPQ). Uncorrected chlorophyll fluorescence measured in daylight, and the computed chlorophyll concentration, will generally be much lower than the value in the same sample measured at night. The CHLA_ADJUSTED values are also corrected for NPQ to bring daytime values into better agreement with the night values that do not suffer from NPQ effects. CHLA_ADJUSTED values that have been corrected for NPQ have a flag value of 5, which corresponds to “Value Changed”.
Finally, the factory dark value, which corresponds to the sensor signal in water with no chlorophyll, has a slight bias when the sensor is installed on a float. The dark value in the adjusted chlorophyll is, therefore, estimated from in situ data following an algorithm that determines the dark signal in depth zones where no chlorophyll is expected. This in situ estimate for the dark counts replaces that from the factory calibration when calculating CHL_ADJUSTED
There is a large body of literature regarding the topic of obtaining a quantitative chlorophyll concentration from a fluorescence measurement, and it is an active topic of research. Therefore we strongly recommend any users to understand the associated limitations with CHLA_ADJUSTED prior to utilizing it for scientific studies.
How are backscatter data adjusted?
For the most part particle backscattering sensors are robust and do not require a calibration adjustment before use. Data flagged 1 or 2 may be used confidently.
Why are negative nitrate values labeled as ‘good’ data?
The raw and adjusted nitrate concentrations may occasionally be reported as negative numbers when surface nitrate concentrations are near zero. It is somewhat traditional in oceanography to set the negative values to zero, as a negative concentration is physically impossible. However, the values returned by a sensor are estimates of concentration and these estimates may be negative when the real concentrations are near zero [Thompson, 1998 (link below)]. For example, if the mean sensor reading was 0 umol/kg, but had a precision of 0.1 umol/kg (1 standard deviation), then one would expect a normal distribution around 0, leading to 50% of the readings from the sensor to be negative values.
Setting the negative, estimated concentrations to zero, a procedure termed ‘‘left censoring’’ of the data, has a detrimental impact on statistical assessments of data near zero concentration [Newman et al., 1989 (link below)]. We therefore retain the negative values in data sets that we report and mark the values with a quality flag indicating good data as these are valid estimates of nitrate concentration. The onus will be on users of the data to decide the appropriate procedure for utilizing these estimated values. This text was taken from Johnson et al. 2017
Johnson et al.2017: https://agupubs.onlinelibrary.wiley.com/doi/10.1002/2017jc012838; doi: https://doi.org/10.1002/2017JC012838
Thompson: https://pubs.rsc.org/en/Content/ArticleLanding/1998/AN/A705702D; doi: https://doi.org/10.1039/A705702D
Newman et al. 1989: https://onlinelibrary.wiley.com/doi/abs/10.1111/j.1752-1688.1989.tb05406.x; doi: https://doi.org/10.1111/j.1752-1688.1989.tb05406.x