DRAFT Getting started with GO-BGC Data
Everything you need to begin working with the data
GO-BGC data can be used freely, with no restrictions. However, we ask that GO-BGC is properly acknowledged when used in a publication or a product.
Float data can be accessed in various formats through multiple data portals
GO-BGC Data Pathway
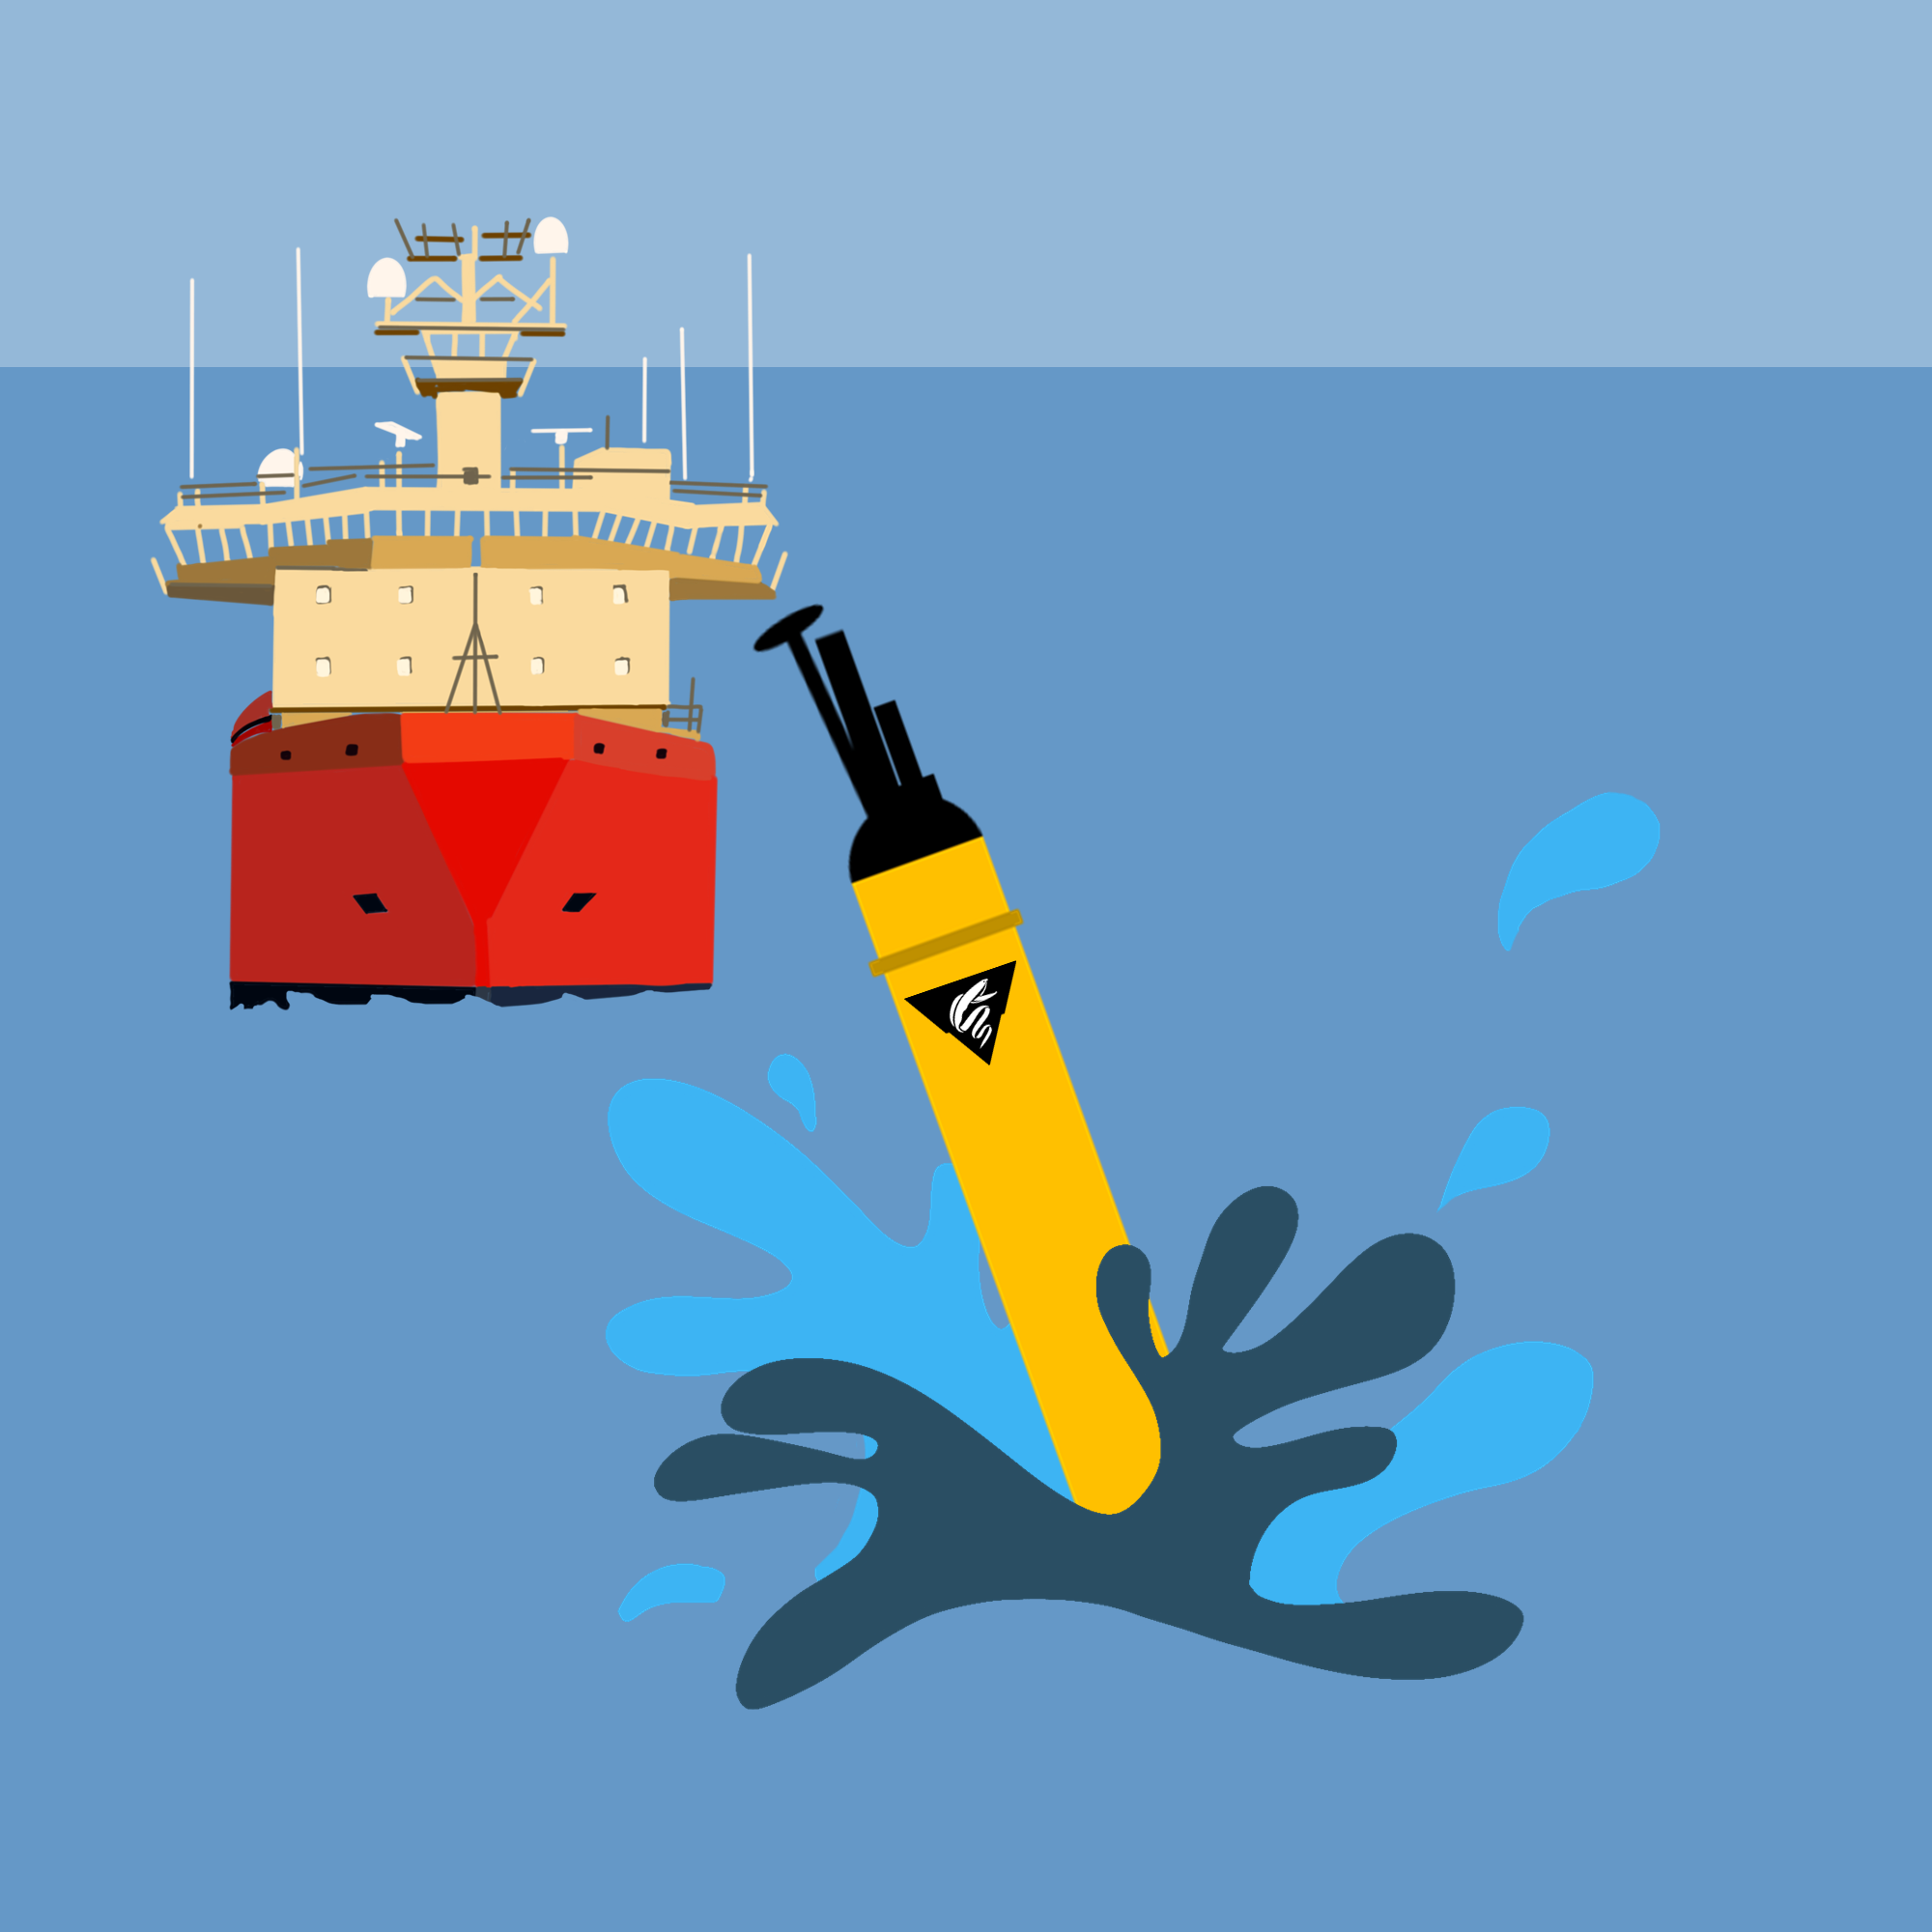
Float Deployment
Research vessels deploy floats in areas of the ocean where more data is needed. Floats will descend to 1,000m and drift there for 10 days.
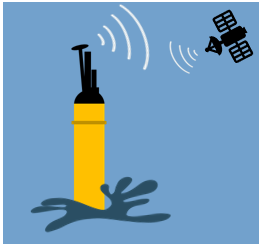
Data Transmission
After drifting for 10 days floats drop to 2000m and then ascend to the surface collecting measurements. Once on the surface the float makes contact with an Argo satellite and transmits the most recent sampling profile data.
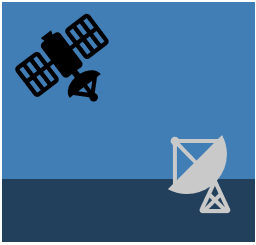
Data Assembly
The Argo satellite transmits float data to Data Assembly Centers (DACs).

Real-time Data
At the DACs float data is filtered using Argo standards.

Delayed-mode Quality Control
Data experts review the float data and compare it to ocean chemistry models. Data is adjusted to account for sensor performance as well.

Adjusted Data
Validated data is recommended for all users and is made available in archive updates every 4 months.
GO-BGC Toolbox Tutorials
MATLAB, Python, and R Github toolboxes are available to help you select, download, and visualize GO-BGC data. These toolboxes access the synthetic profile (sprof) files directly from the Argo GDAC. Detailed instructions on how to read sprof files are included in the Github readme files and available through these tutorial videos (also available through our Resources tab):
Key functionalities of the toolboxes allow you to:
-
- Download a specific float using its WMO ID number
- Select and download floats that are equipped with desired sensors
- Select and download profiles made within a specific geographic location and time
- Create a variety of plots, including trajectory of float(s), raw and QC’d profile data, and contour plots.
Data Adjustment
BGC float data are automatically adjusted to deliver science quality data in near-real time following established protocols that are specific to each parameter. Documentation on how each parameter is adjusted can be found here. Below, you can find videos that summarize the adjustment process, as well as the quality of the resultant data.
O2 Measurements
For adjusting O2 data skip to
29:16
pH Measurements
For adjusting pH data skip to
24:39
Nitrate Measurements
For adjusting nitrate data skip to
19:52
Delayed Mode Quality Control
This methods article by Tanya Maurer, Josh Plant, and Ken Johnson at MBARI explains more about Delayed Mode Quality Control.
Post-deployment quality control (QC) of float-based oxygen, nitrate, and pH data is a crucial step in the processing and dissemination of such data, as in situ chemical sensors remain in early stages of development. In situ calibration of chemical sensors on profiling floats using atmospheric reanalysis and empirical algorithms can bring accuracy to within 3 μmol O2 kg–1, 0.5 μmol NO3– kg–1, and 0.007 pH units..
Routine QC efforts utilizing these methods can be conducted manually through visual inspection of data to assess sensor drifts and offsets, but more automated processes are preferred to support the growing number of BGC floats and reduce subjectivity among delayed-mode operators. The BGC-Argo data center at MBARI has developed the SAGE and SAGE-O2 software tools to facilitate the QC process. The paper by Maurer et al. describes these tools, which are available to the public on Github.