Data Visualization
Resources to help students explore float data
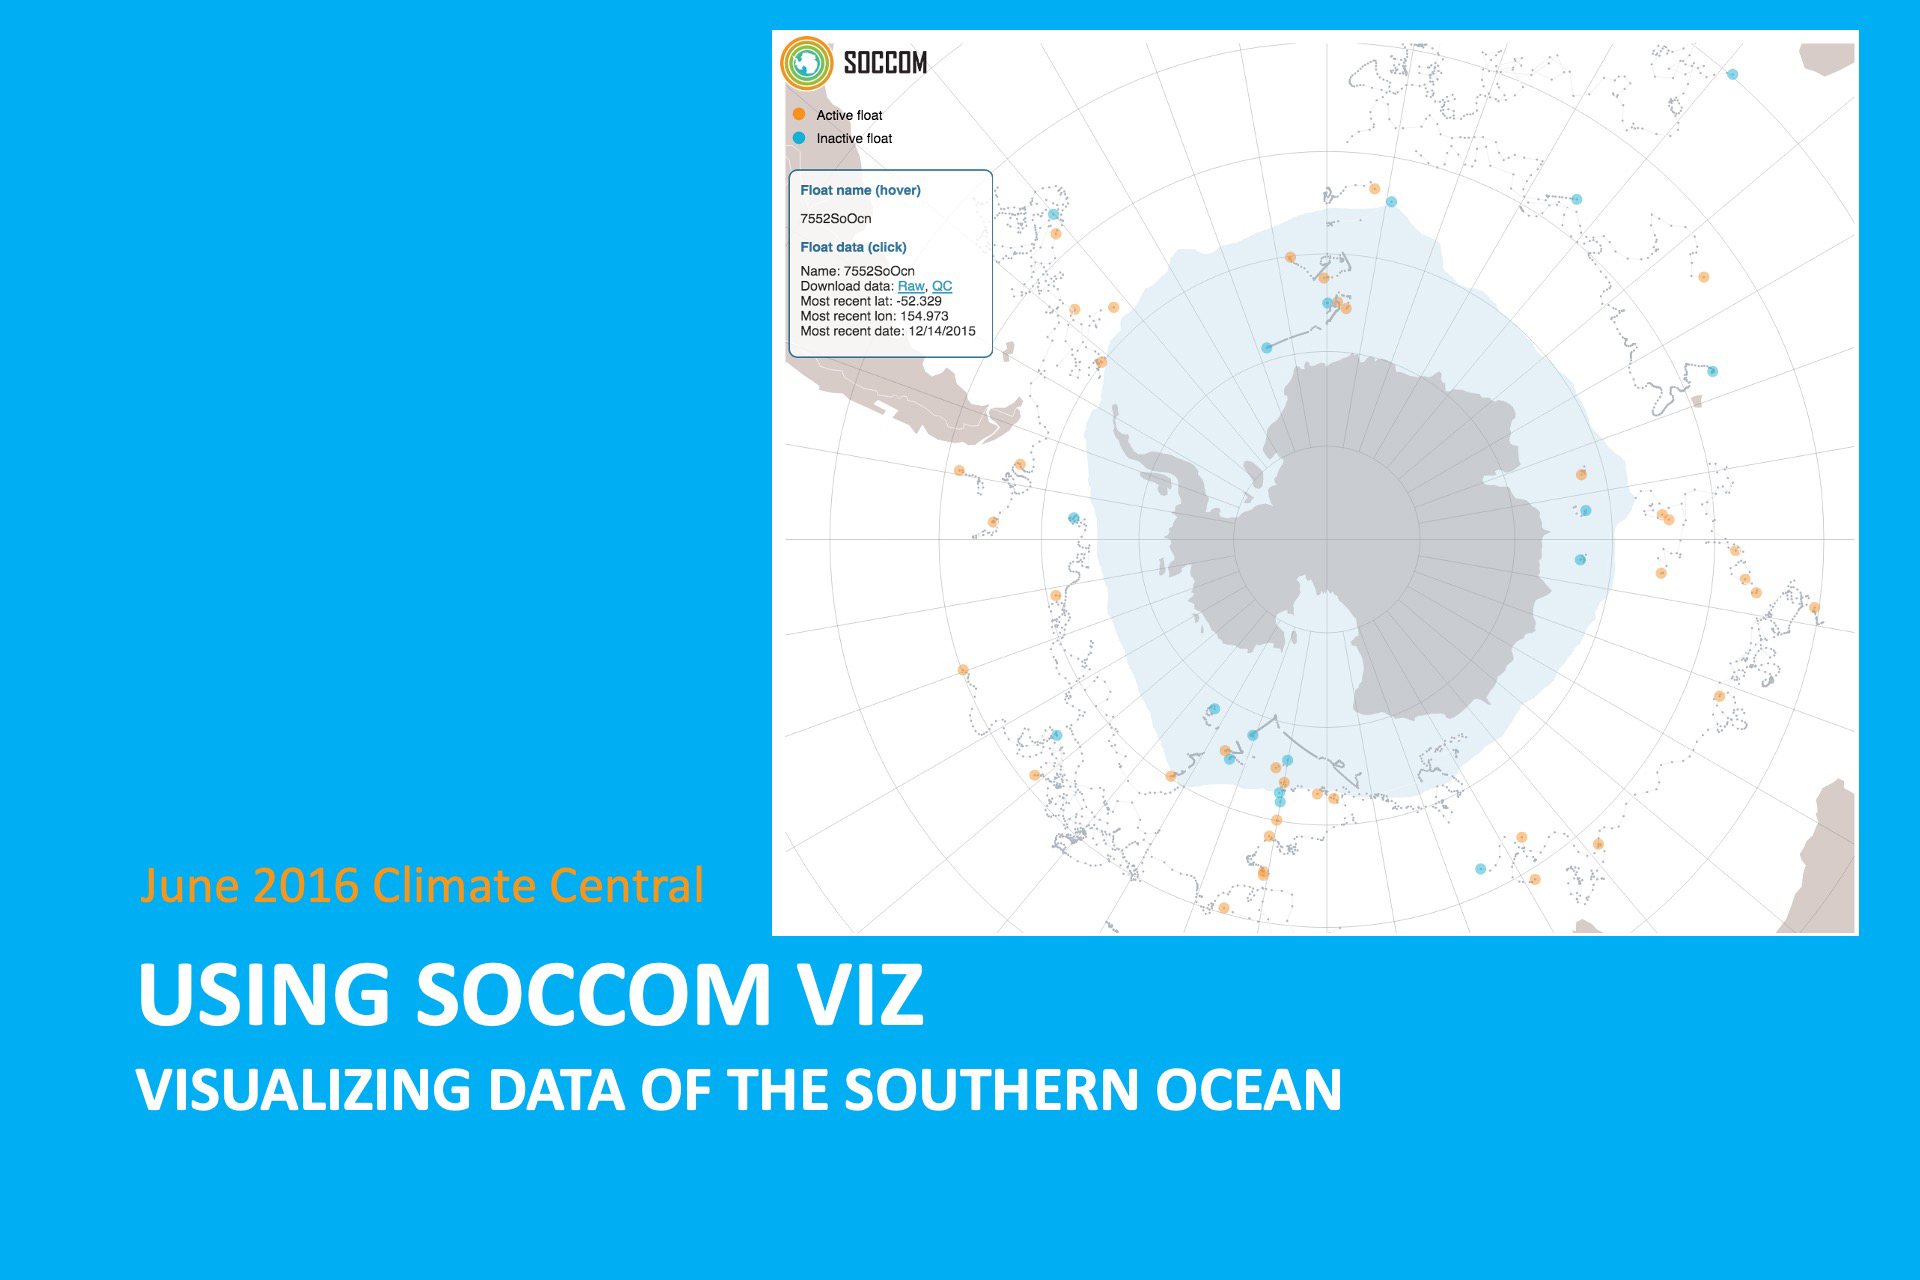
Using SOCCOM Viz: Visualizing Data of the Southern Ocean
8-slide PowerPoint presentation on using SOCCOM Viz.
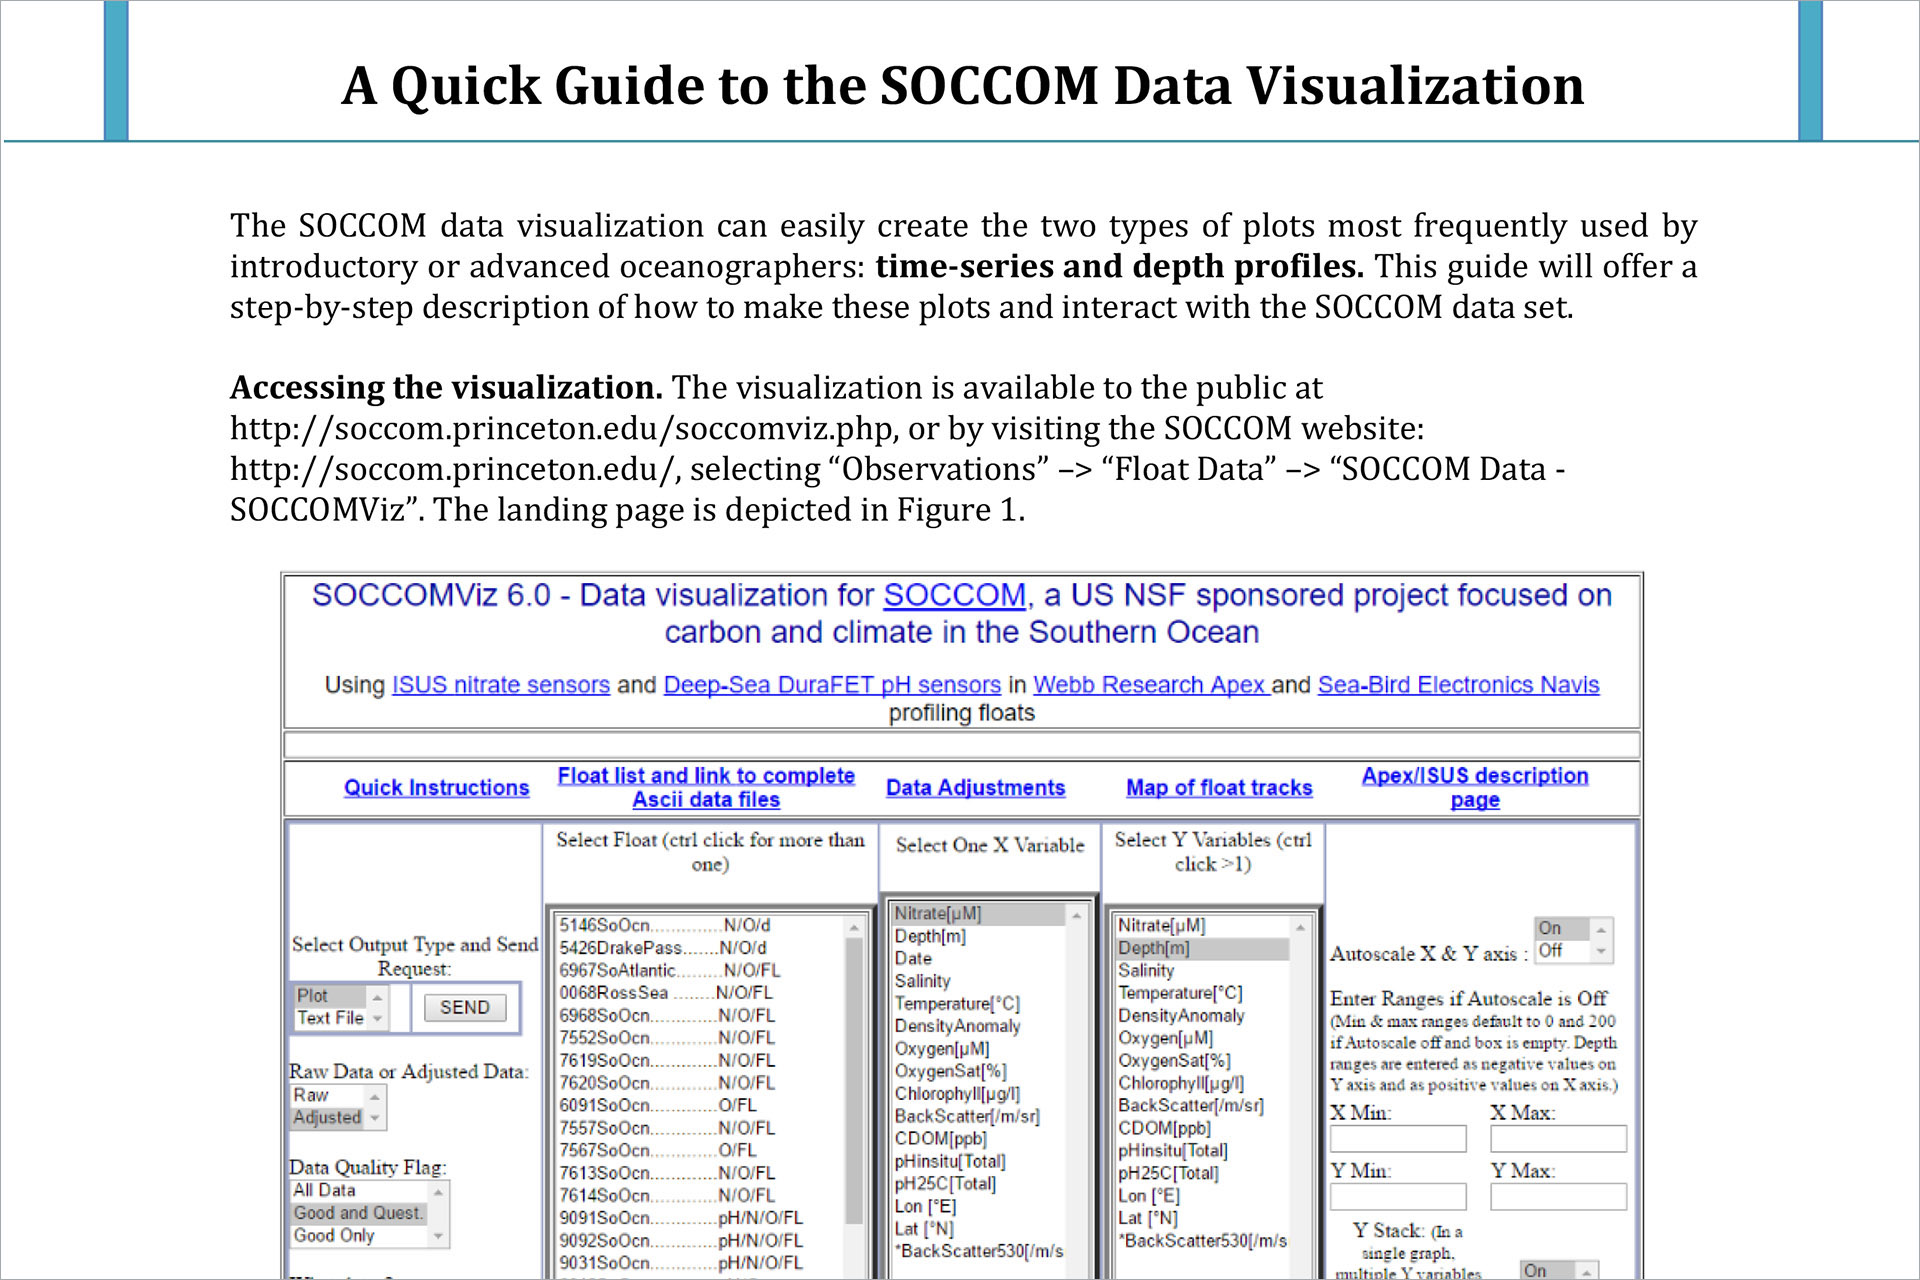
A Quick Guide to the SOCCOM Data Visualization
2-page guide offers a step-by-step description of how to make time-series and depth profile plots and interact with the SOCCOM data set.
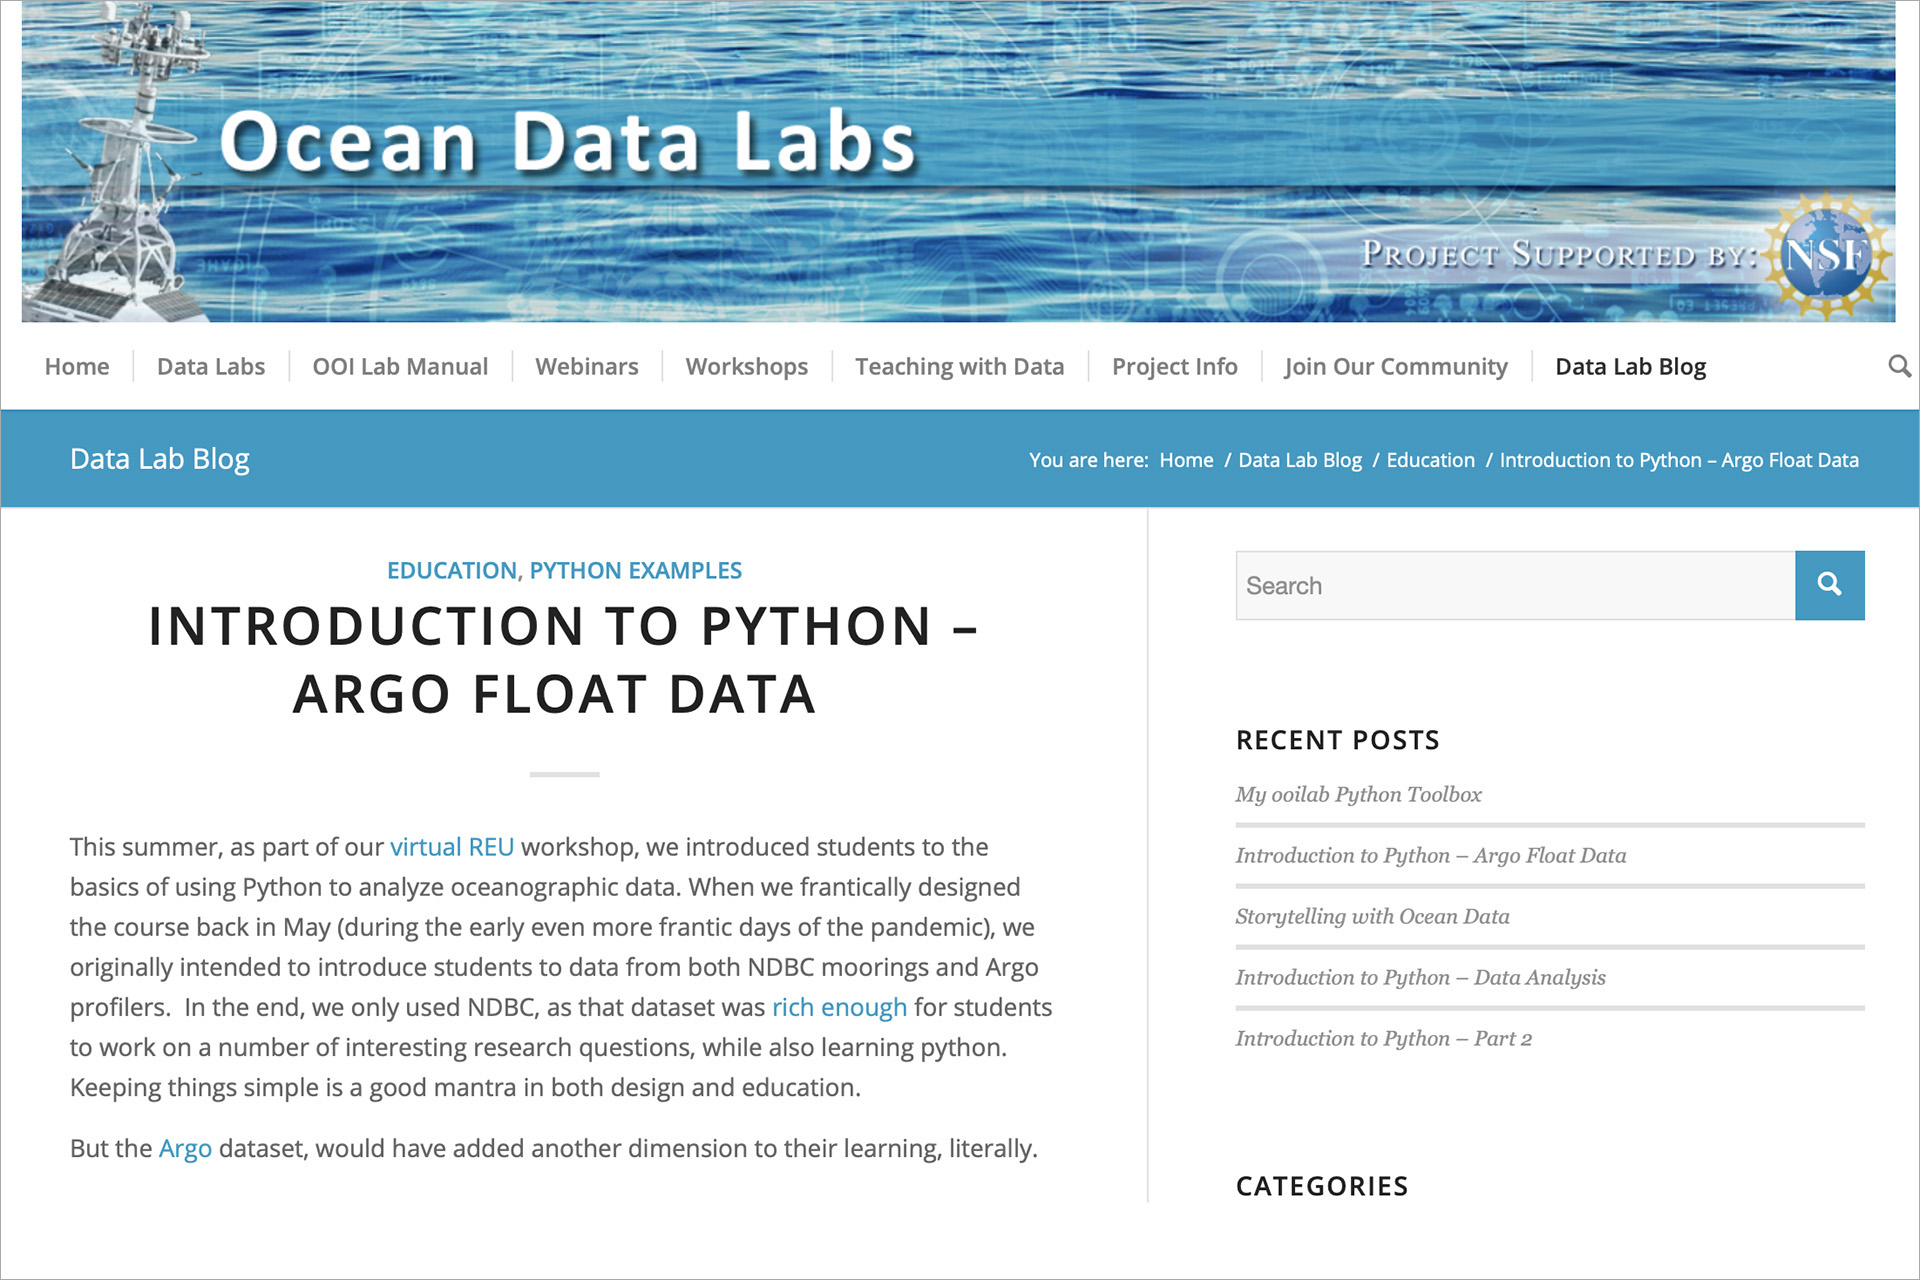
Introduction To Python – Argo Float Data
Rutgers University Data Lab Blog introducing students to the basics of using Python to analyze oceanographic data.