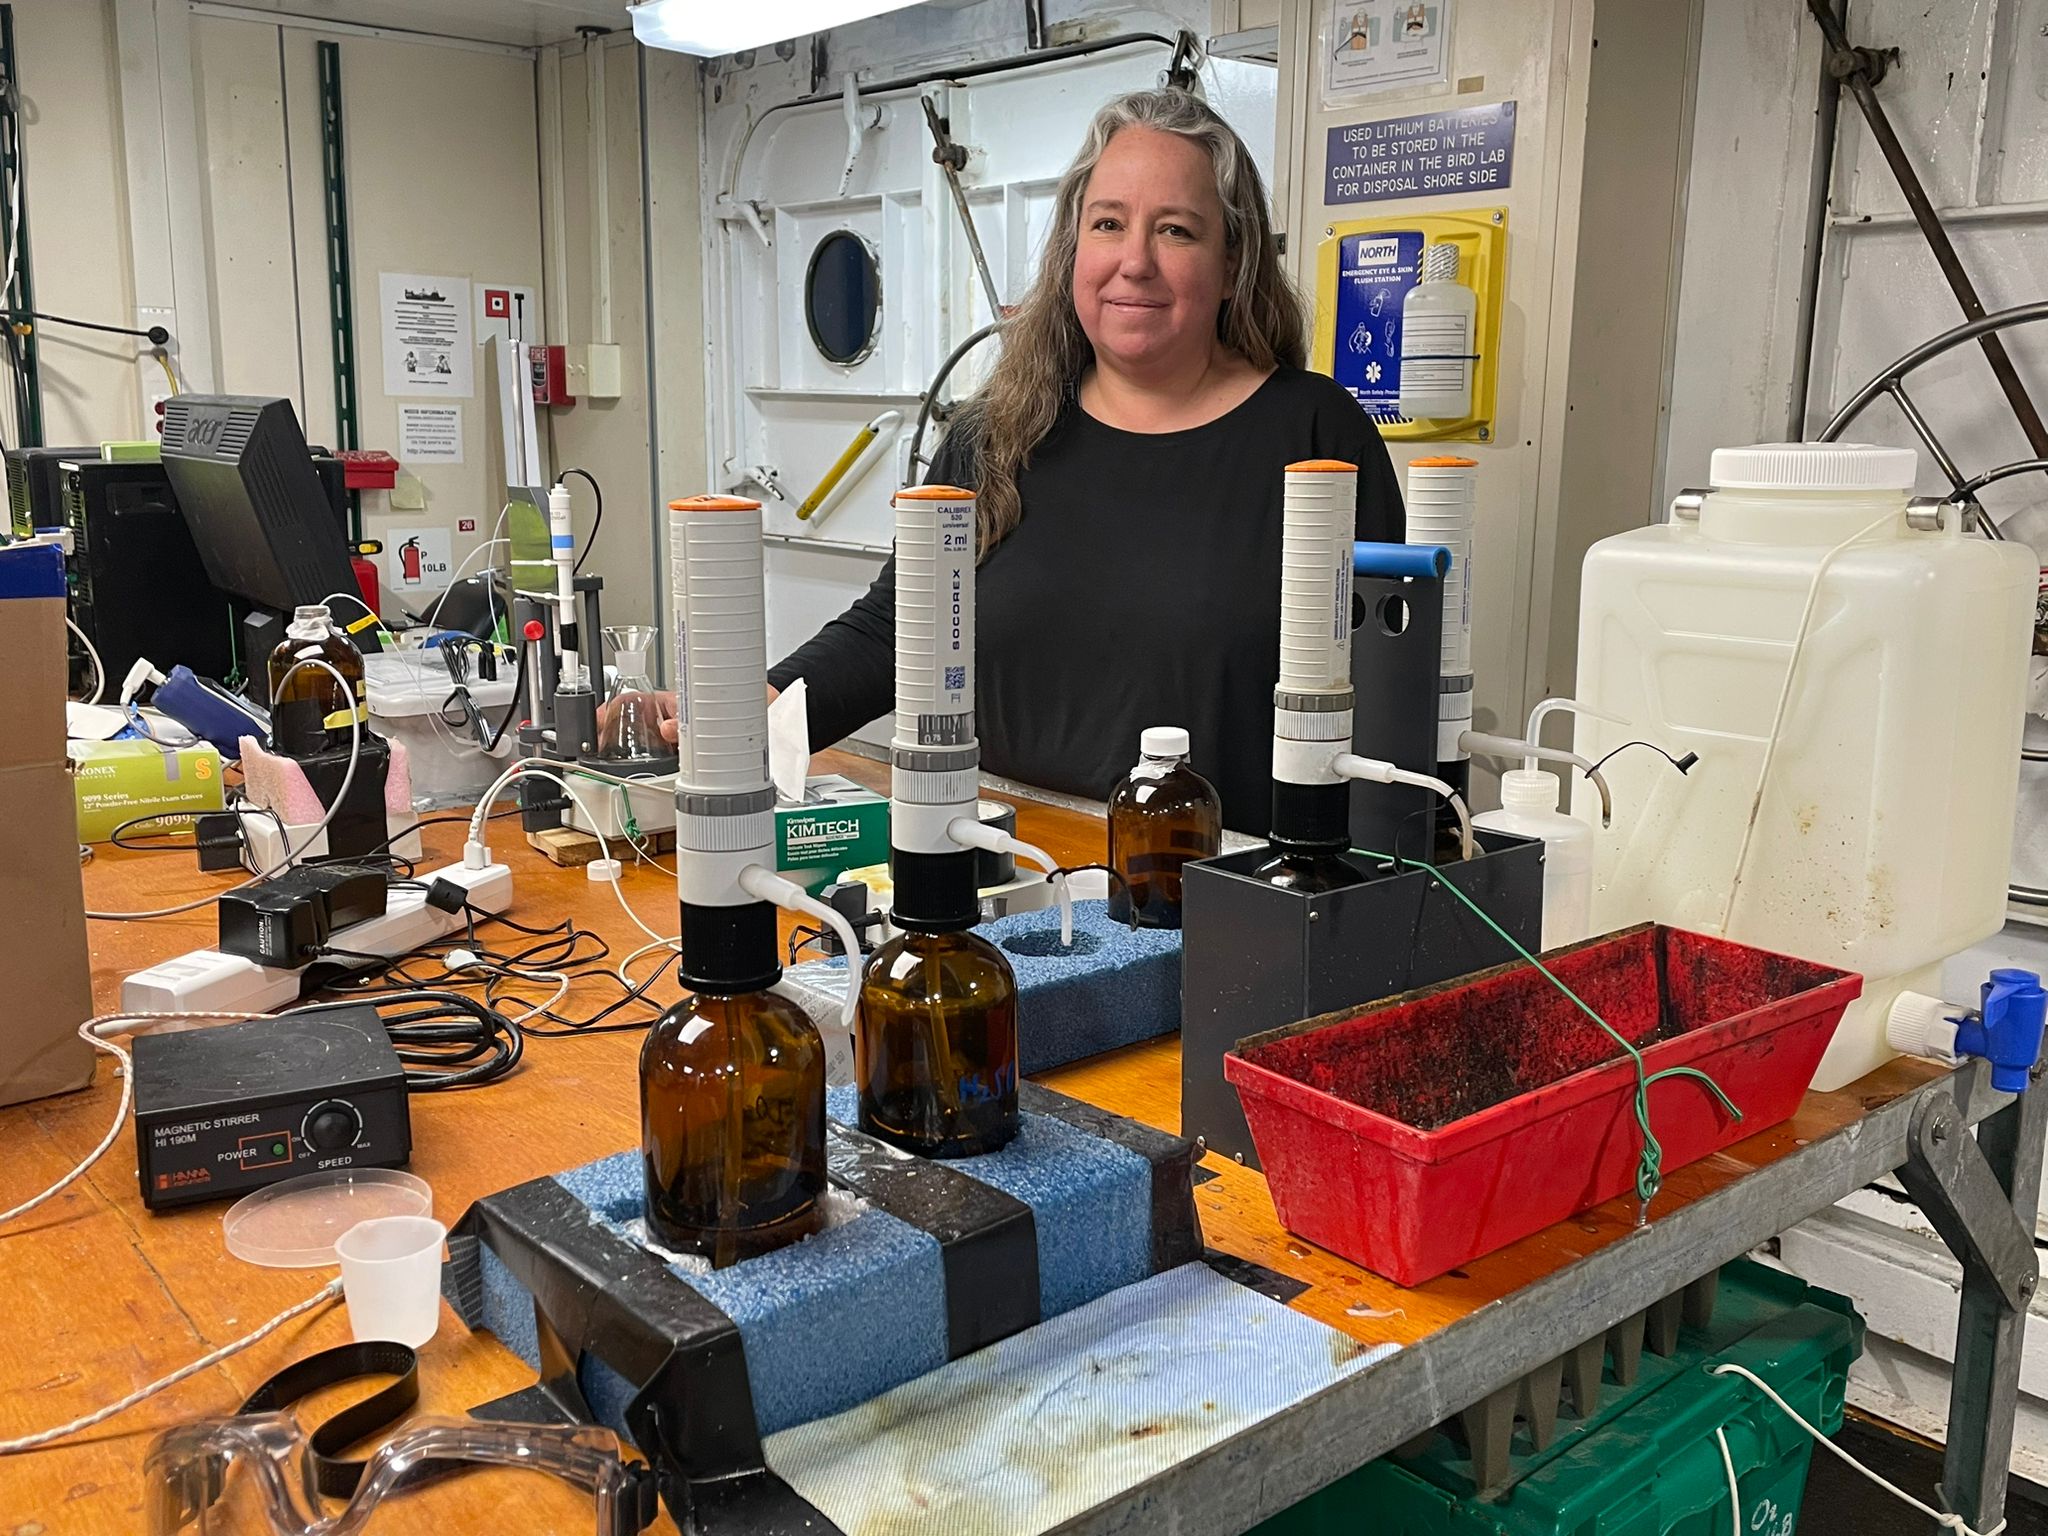
The Wonderful World of Alchemical Oxygen
Modifications to Classic Water Chemistry
11 March 2024
Alchemy is essentially the art of turning one substance into another purer form, or finding the deeper, true value of it through some magical route. Often it is thought of as being done by sorcerers, visionaries, and magicians. The quest for a magical elixir to everything, or, perhaps, pure gold from other metals, were forming forces in the field of chemistry. The inherent need to break things down to raw substances so they can be recombined led to the classification of gases, liquids, and solids (and later, plasma).
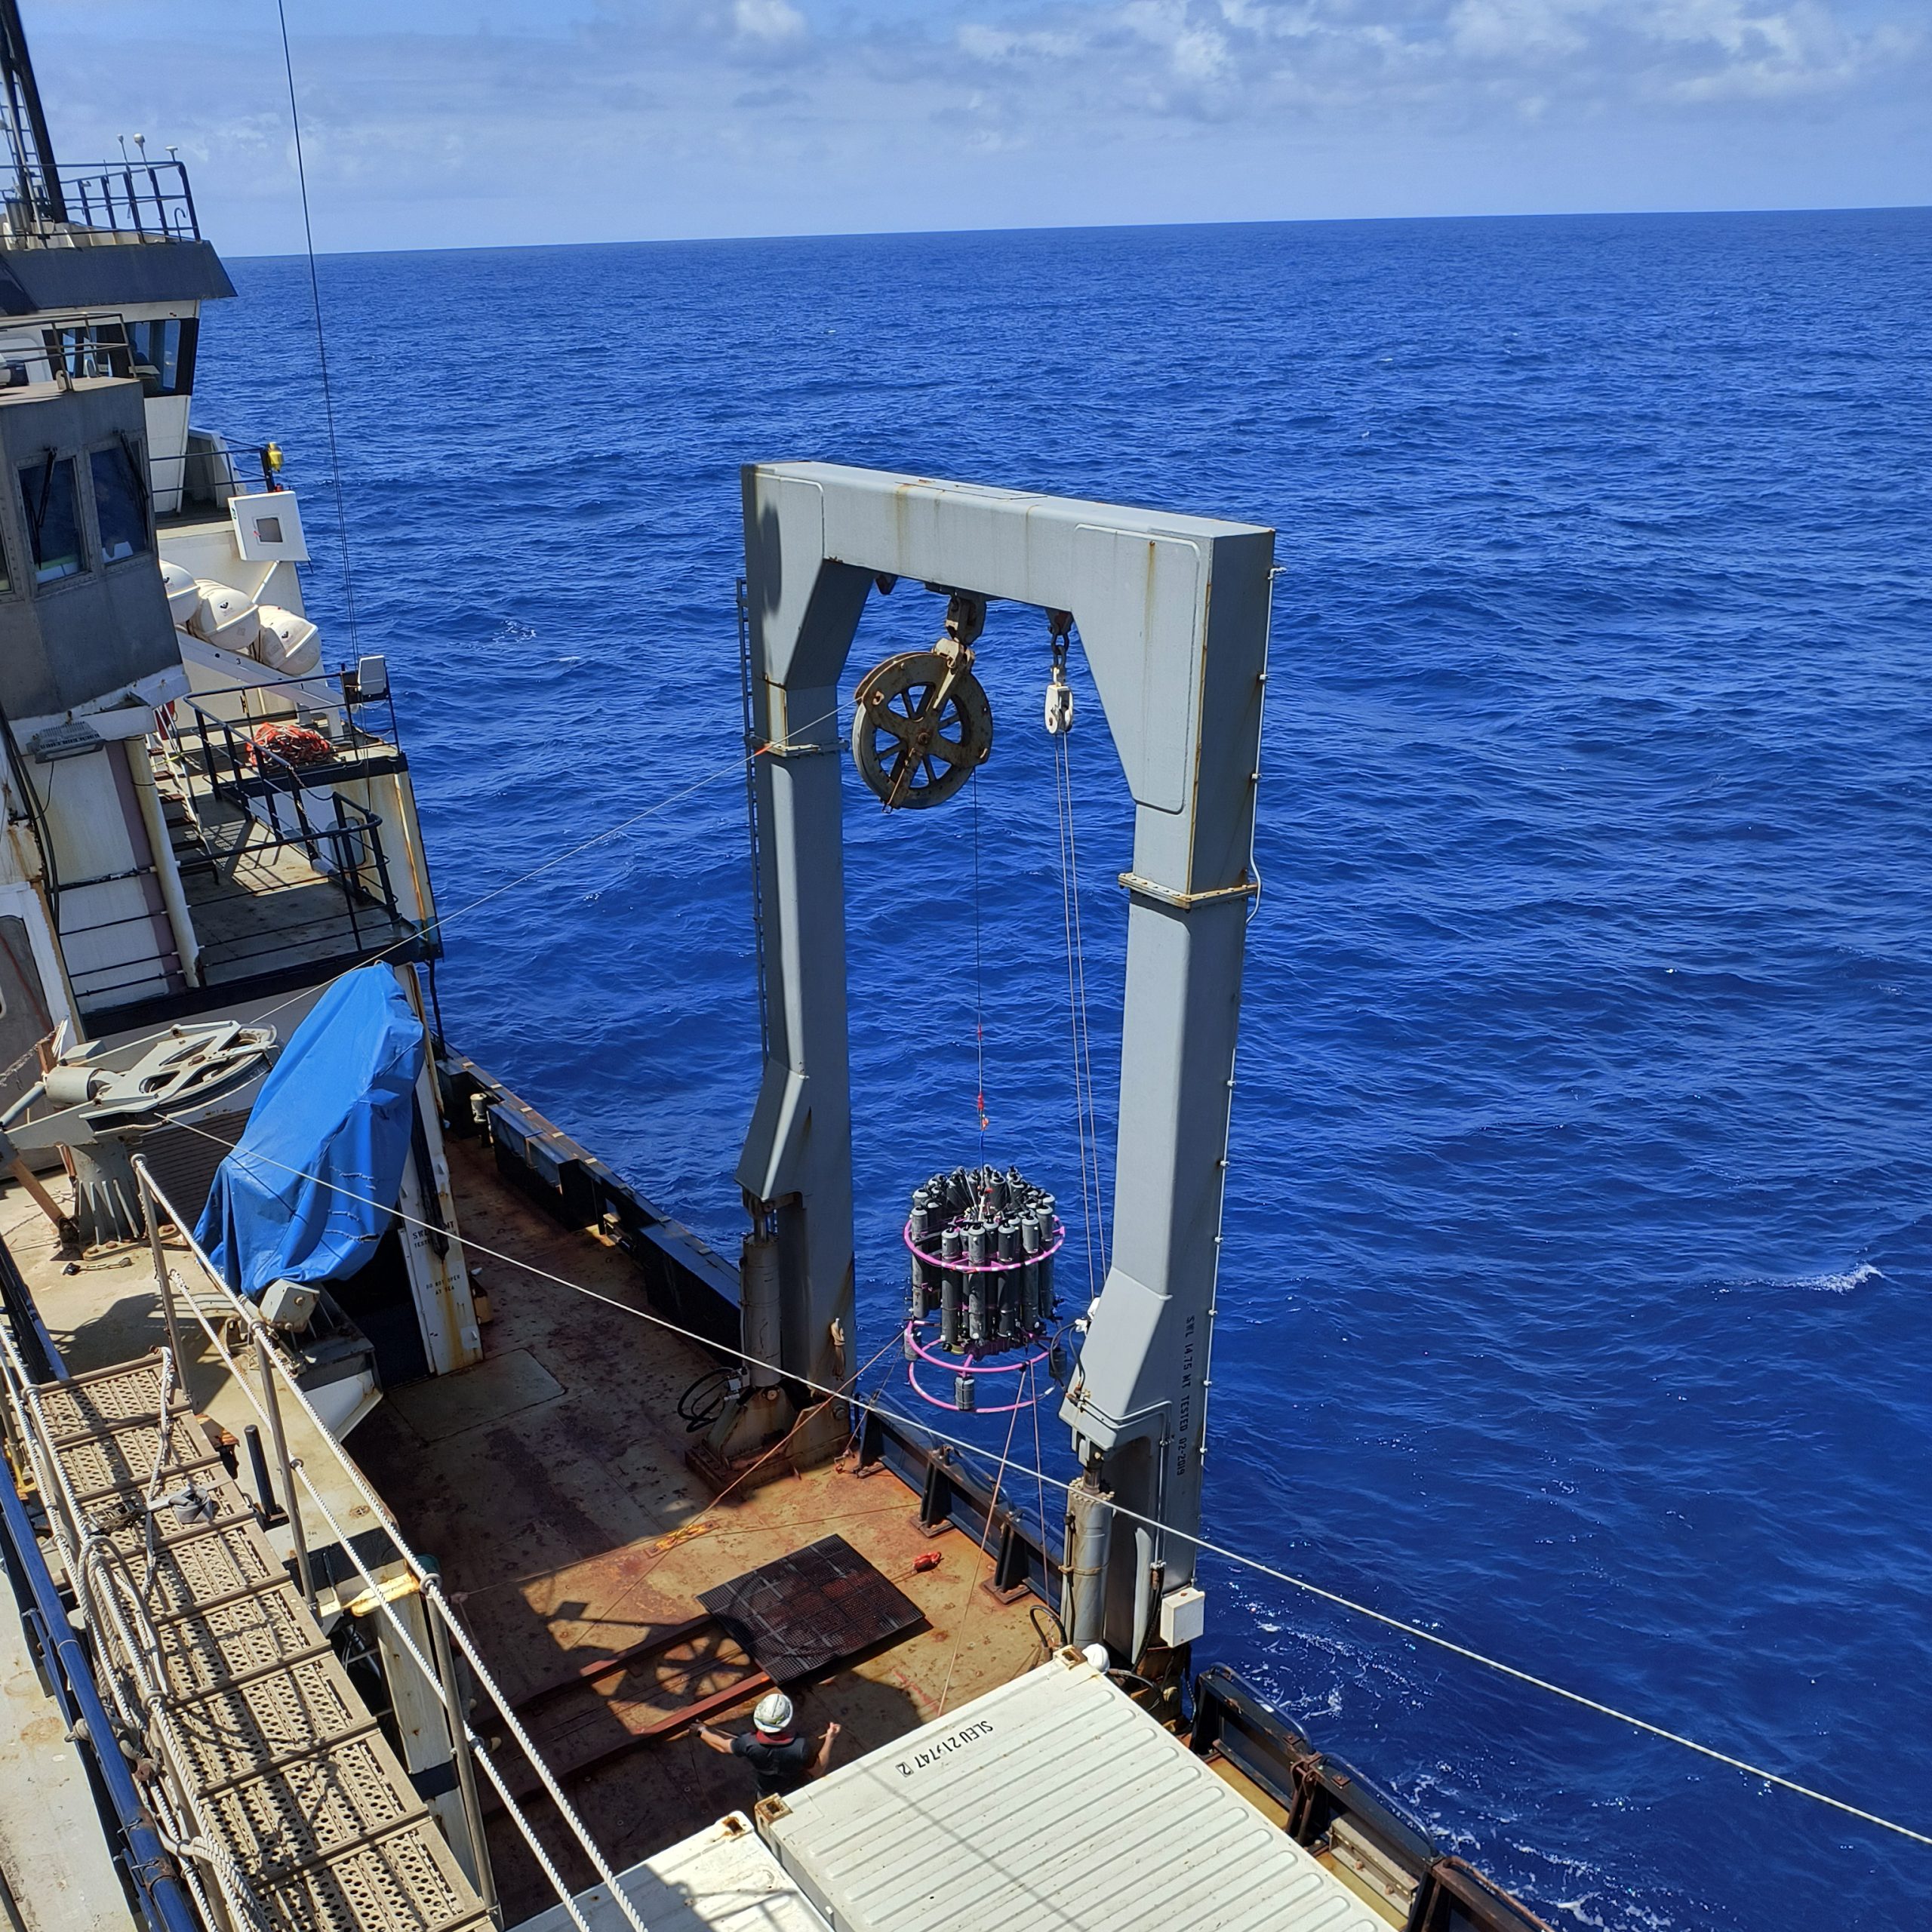
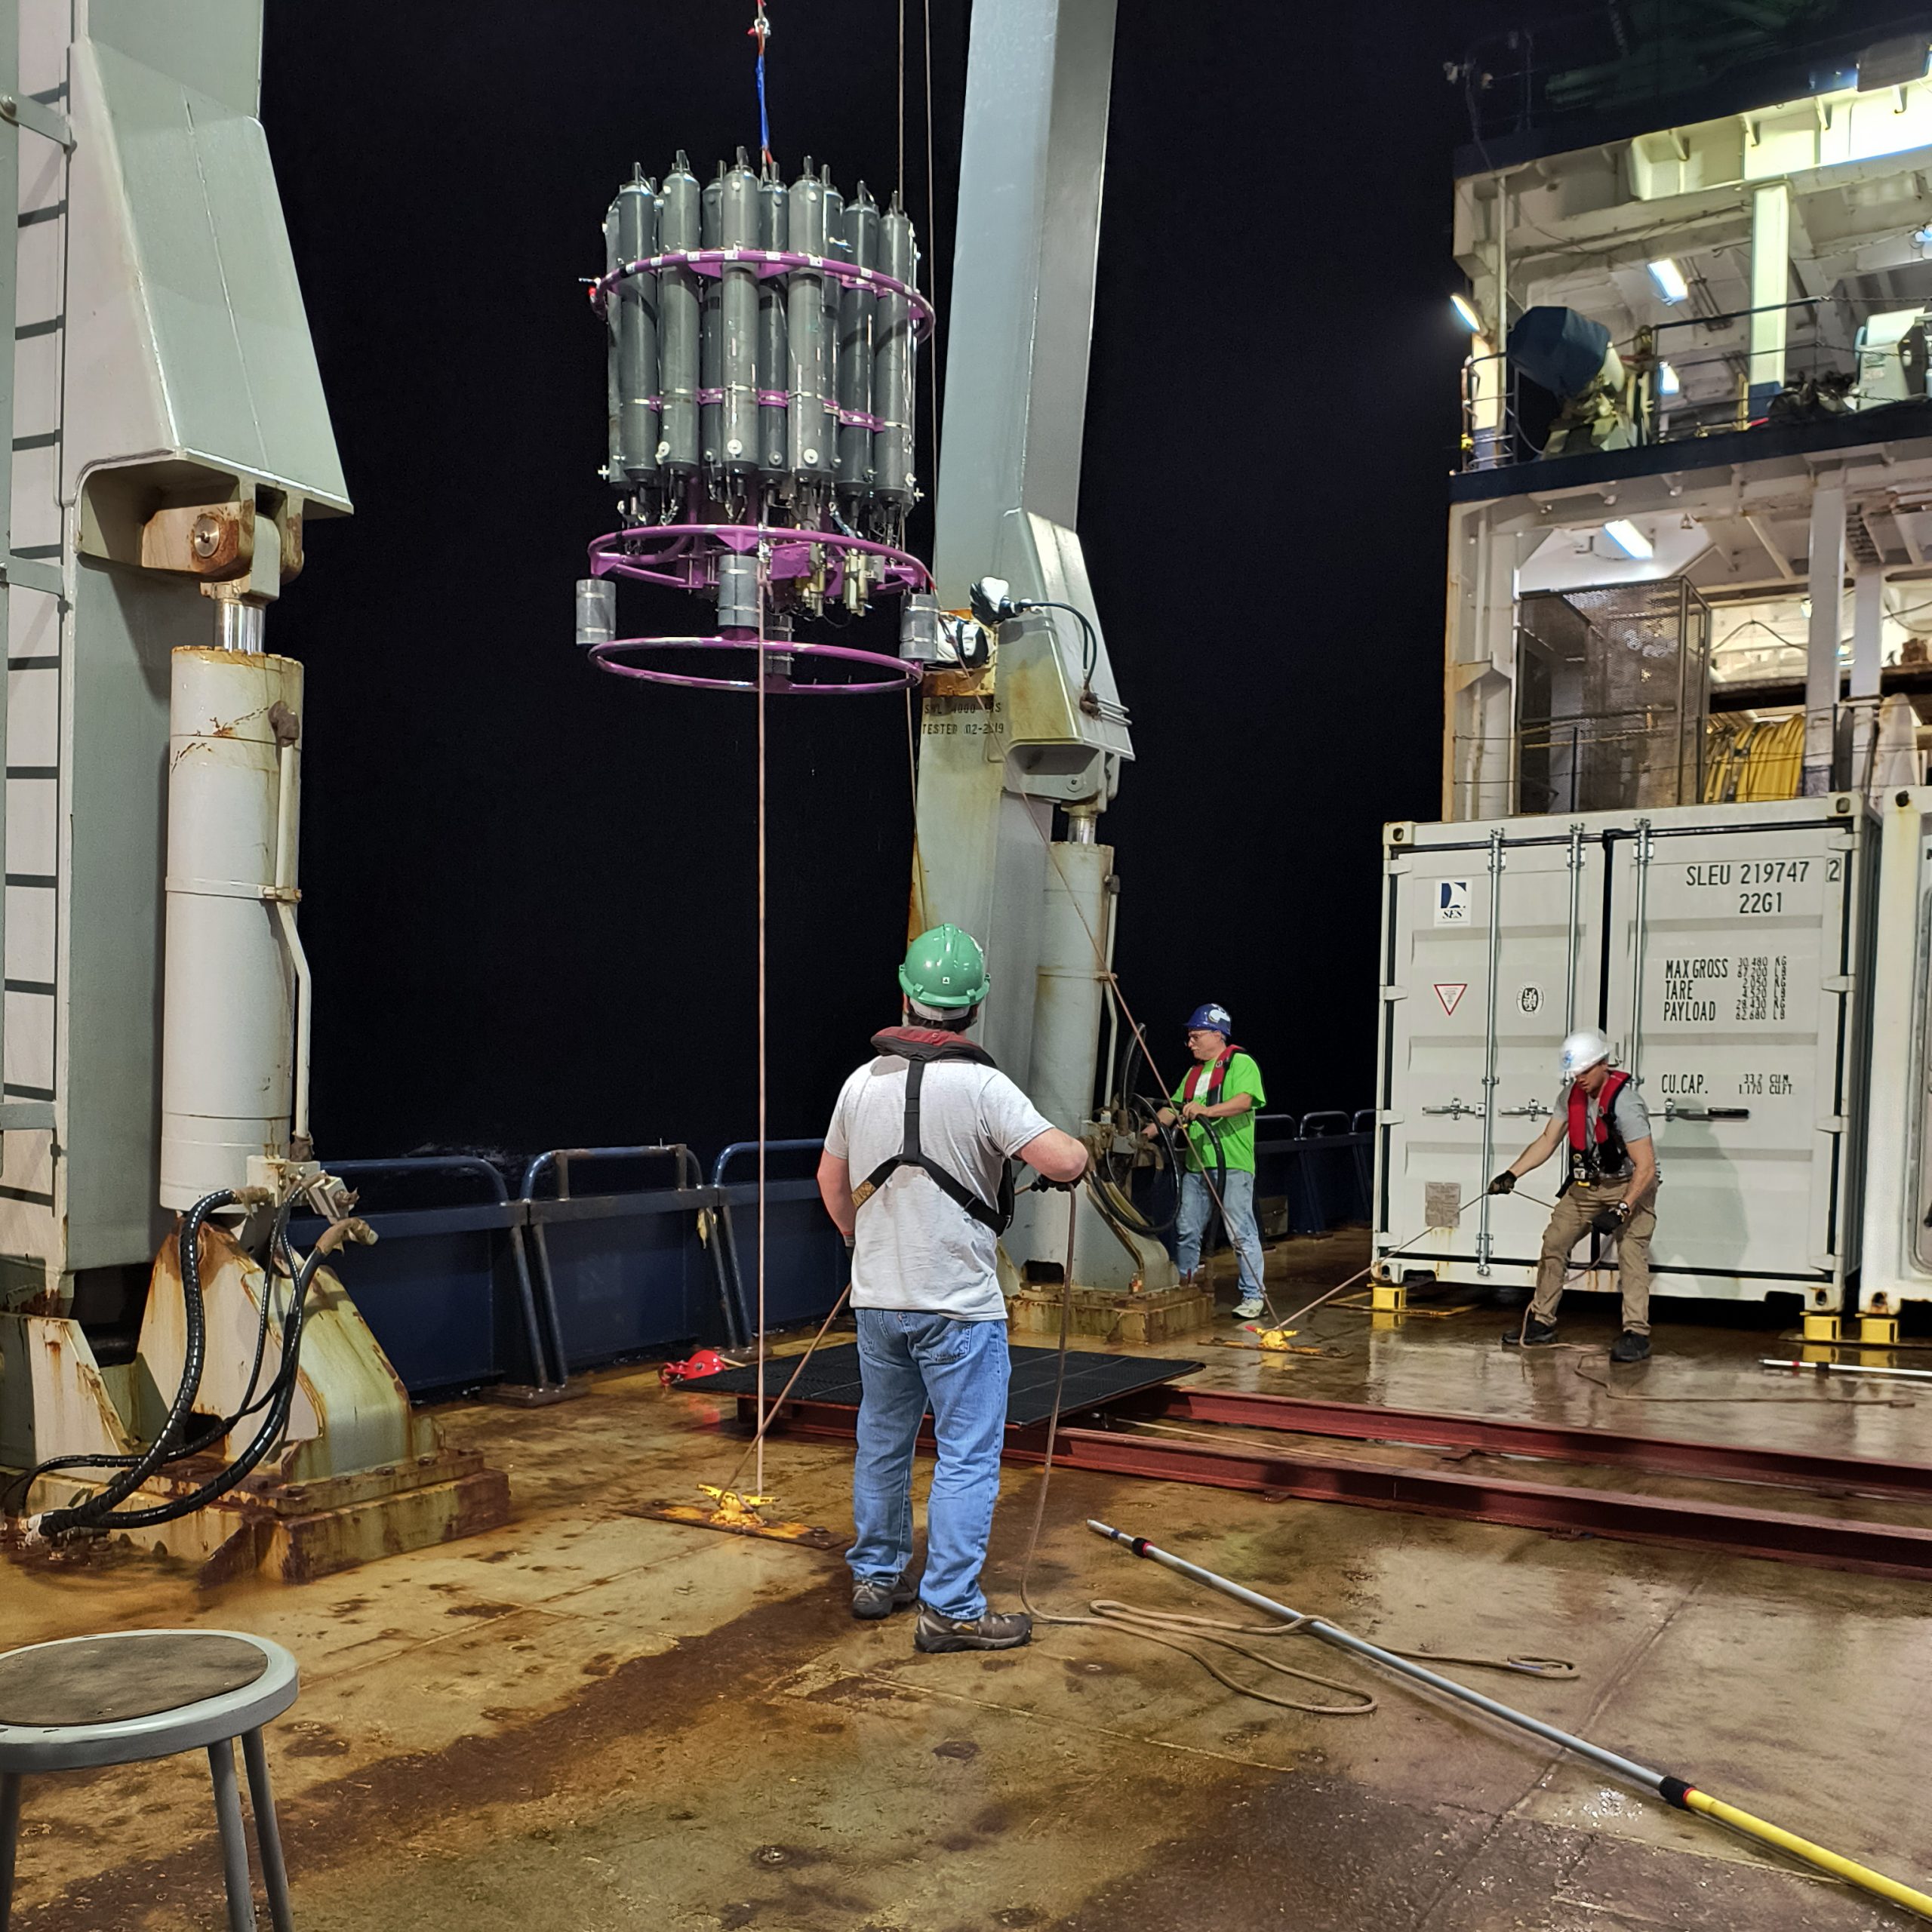
“What’s in there?” is the most common question asked by others gathering samples around the CTD rosette (see pictures above) when they see me pump two milliliters of mysterious chemicals into our unique shaped sampling flasks filled with water fresh out of the Niskin bottles. The Niskin bottles attached to the rosette gather water samples from 24 predetermined depths. Since shrugging and saying, “chemistry”, or “alchemy,” isn’t always the most scientific response, here’s the more detailed explanation.
Samples are being prepped to perform a Winkler Titration. This method is widely utilized in aquatic science to determine the concentration of dissolved oxygen in water samples. Oxygen measurement is considered a critical parameter in assessing the water quality of natural water bodies such as lakes, rivers, and oceans, as well as in wastewater treatment processes. The method was first developed by Lajos Winkler in 1888, and it has been widely used and refined over the years.
Interestingly enough, Lajos did not receive his PhD until 1889, so the method still used today (though modified) was developed while he was a student in Budapest. He published over 400 other scientific papers during his tenure as a scientist. He was head of the Institute of Chemistry in Hungary for over 25 years and researched absorption coefficients of gases in various solutions, among other work. Interestingly, Winkler’s advisor, Than, studied directly under Bunsen – of the ubiquitous “Bunsen burner.” Winkler’s absorption coefficients replaced Bunsen’s, and have since stood the test of time. He worked as an assistant to a pharmacologist when younger, and there is a Winkler award in pharmacology still given today. Is it gold? Likely not, but it is given to someone demonstrating their ability to come closer to a pure elixir (we hope).
The measurement of oxygen in natural waters continues to feel like modern alchemy. Chemical oceanographers with GO-SHIP now use a refined detection strategy. Since we are nearing the end of the voyage, I feel like I have more experience with the three modern versions and will do my best to explain what we’re doing.
If you were to take an aquatic chemistry class today, you would likely perform the manual titration method as published by Carpenter in 1965. This method, like the original, relies on the human eye for endpoint detection and requires the use of a starch that is messy if spilled, and not good to bring to sea. As I have been doing this chemistry for over 30 years, I am certain my eyes today would not detect the same endpoint they would have when I began. The error introduced when changing analysts could be even greater.
When I began going to sea, a photometric method was widely in use. This relied on the instrument to detect the endpoint and removed error between samplers. This is still a commonly used methodology. The method now used, which will be described in great detail below, is the amperometric method, no longer relying on visual interpretation.
That’s all lovely, but the question remains, “what’s in there?” The ‘Winkler Flask’ has a unique shape so two chemicals can be added to the sample, the bottle capped, well mixed (shaken, not stirred), and allowed to form a precipitate. The precipitate is then acidified and titrated, directly allowing calculation of the oxygen concentration. But what’s happening? What are the colors, and the precipitate?
Our samples are collected from a rosette. The rosette is sent down to near the bottom of our station and collects 24 discrete water samples in Niskin bottles, representative of the water at the depth collected. Once it is brought back on deck, oxygen is the second sample collected when the Niskin bottles are vented. Oxygen is collected carefully to decrease the odds of adding extra oxygen via bubbles or contaminated water. And yes, that’s a thermometer in the sample flask in the picture above as well, because it’s imperative to know the temperature at collection in order to determine the proper density of seawater and calculate micromoles of Oxygen/kg instead of just micromoles of Oxygen/L. There is an oxygen sensor on the rosette as it goes down, our samples are used to ground truth this sensor.
The method used on this trip is detailed by C. Langdon in the GO-SHIP manual, entitled Determination of Dissolved Oxygen in Seawater by Winkler Titration Using the Amperometric Technique. The method involves adding two chemicals to a water sample: manganese chloride and a sodium hydroxide/sodium iodide solution. The flask is capped and vigorously shaken, resulting in a precipitate of manganous hydroxide. The amount of precipitate formed is dependent on how much dissolved oxygen is in the sample. The reaction between manganese chloride and oxygen only happens at high pH, hence the addition of a strong base, sodium hydroxide. Before analysis, the samples are shaken a second time, ensuring all oxygen has been brought into the precipitate. I’ve gone back and forth about including chemical reactions and opted against it, you’re welcome!
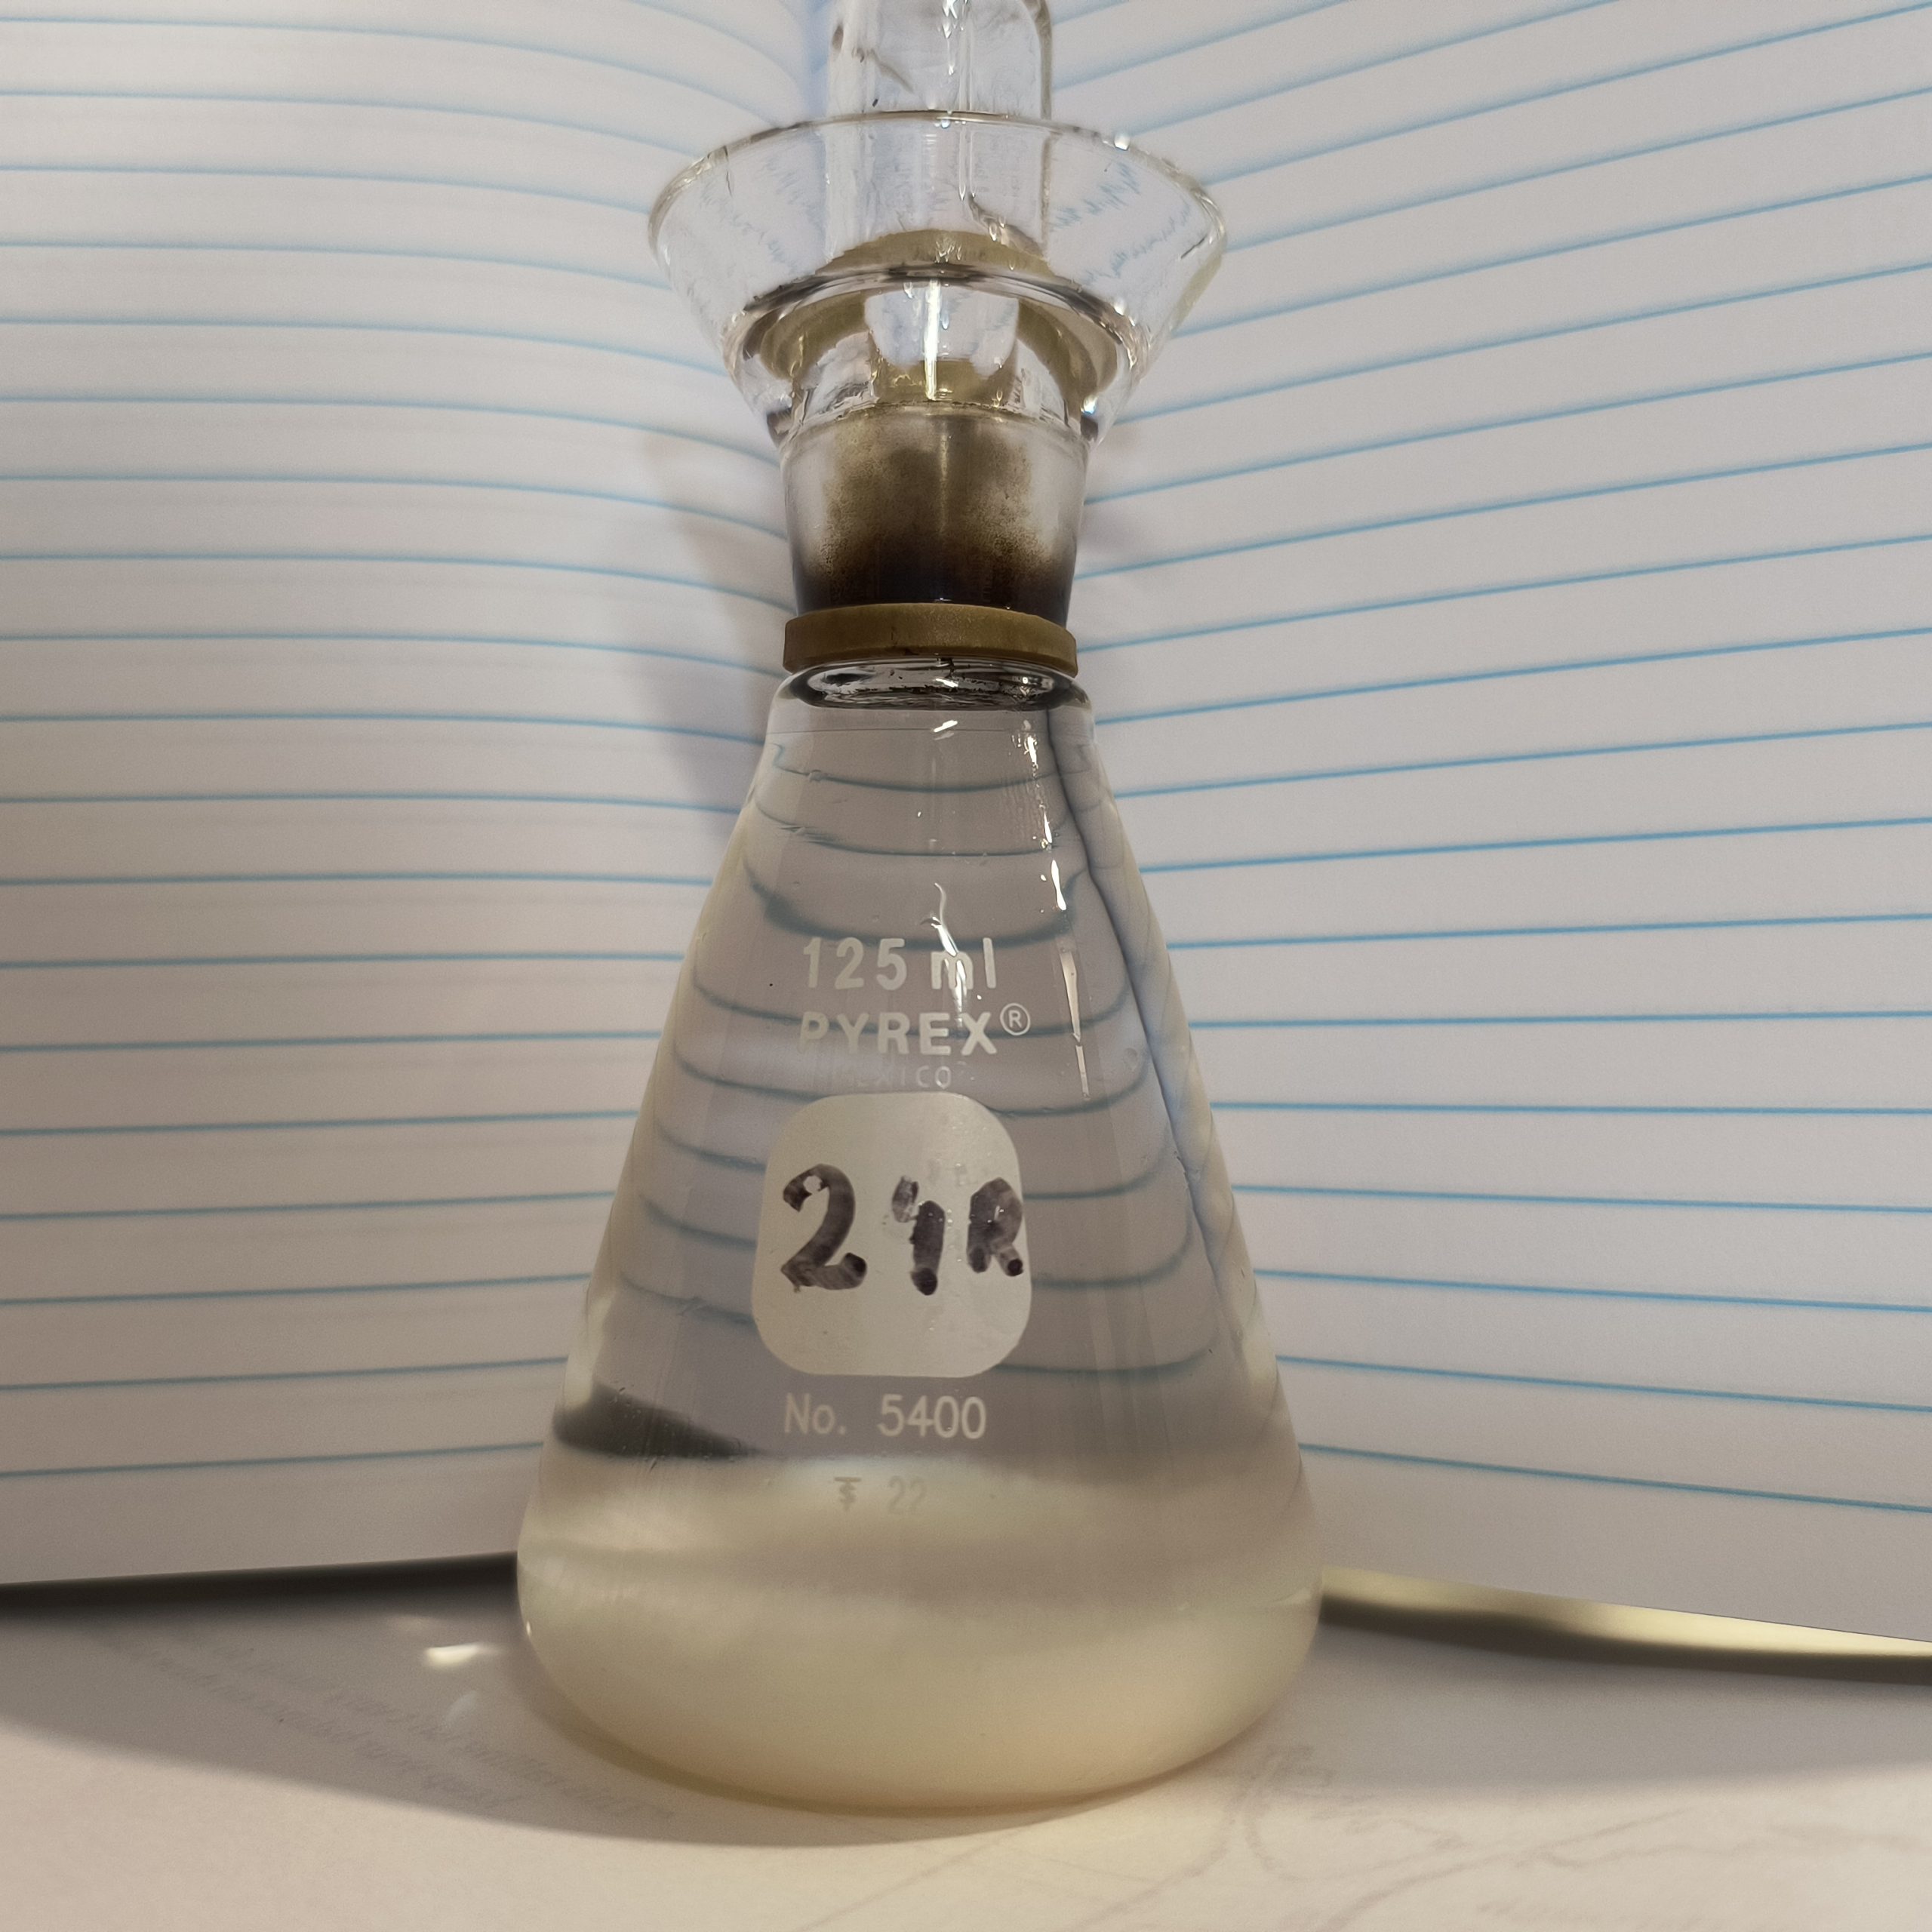
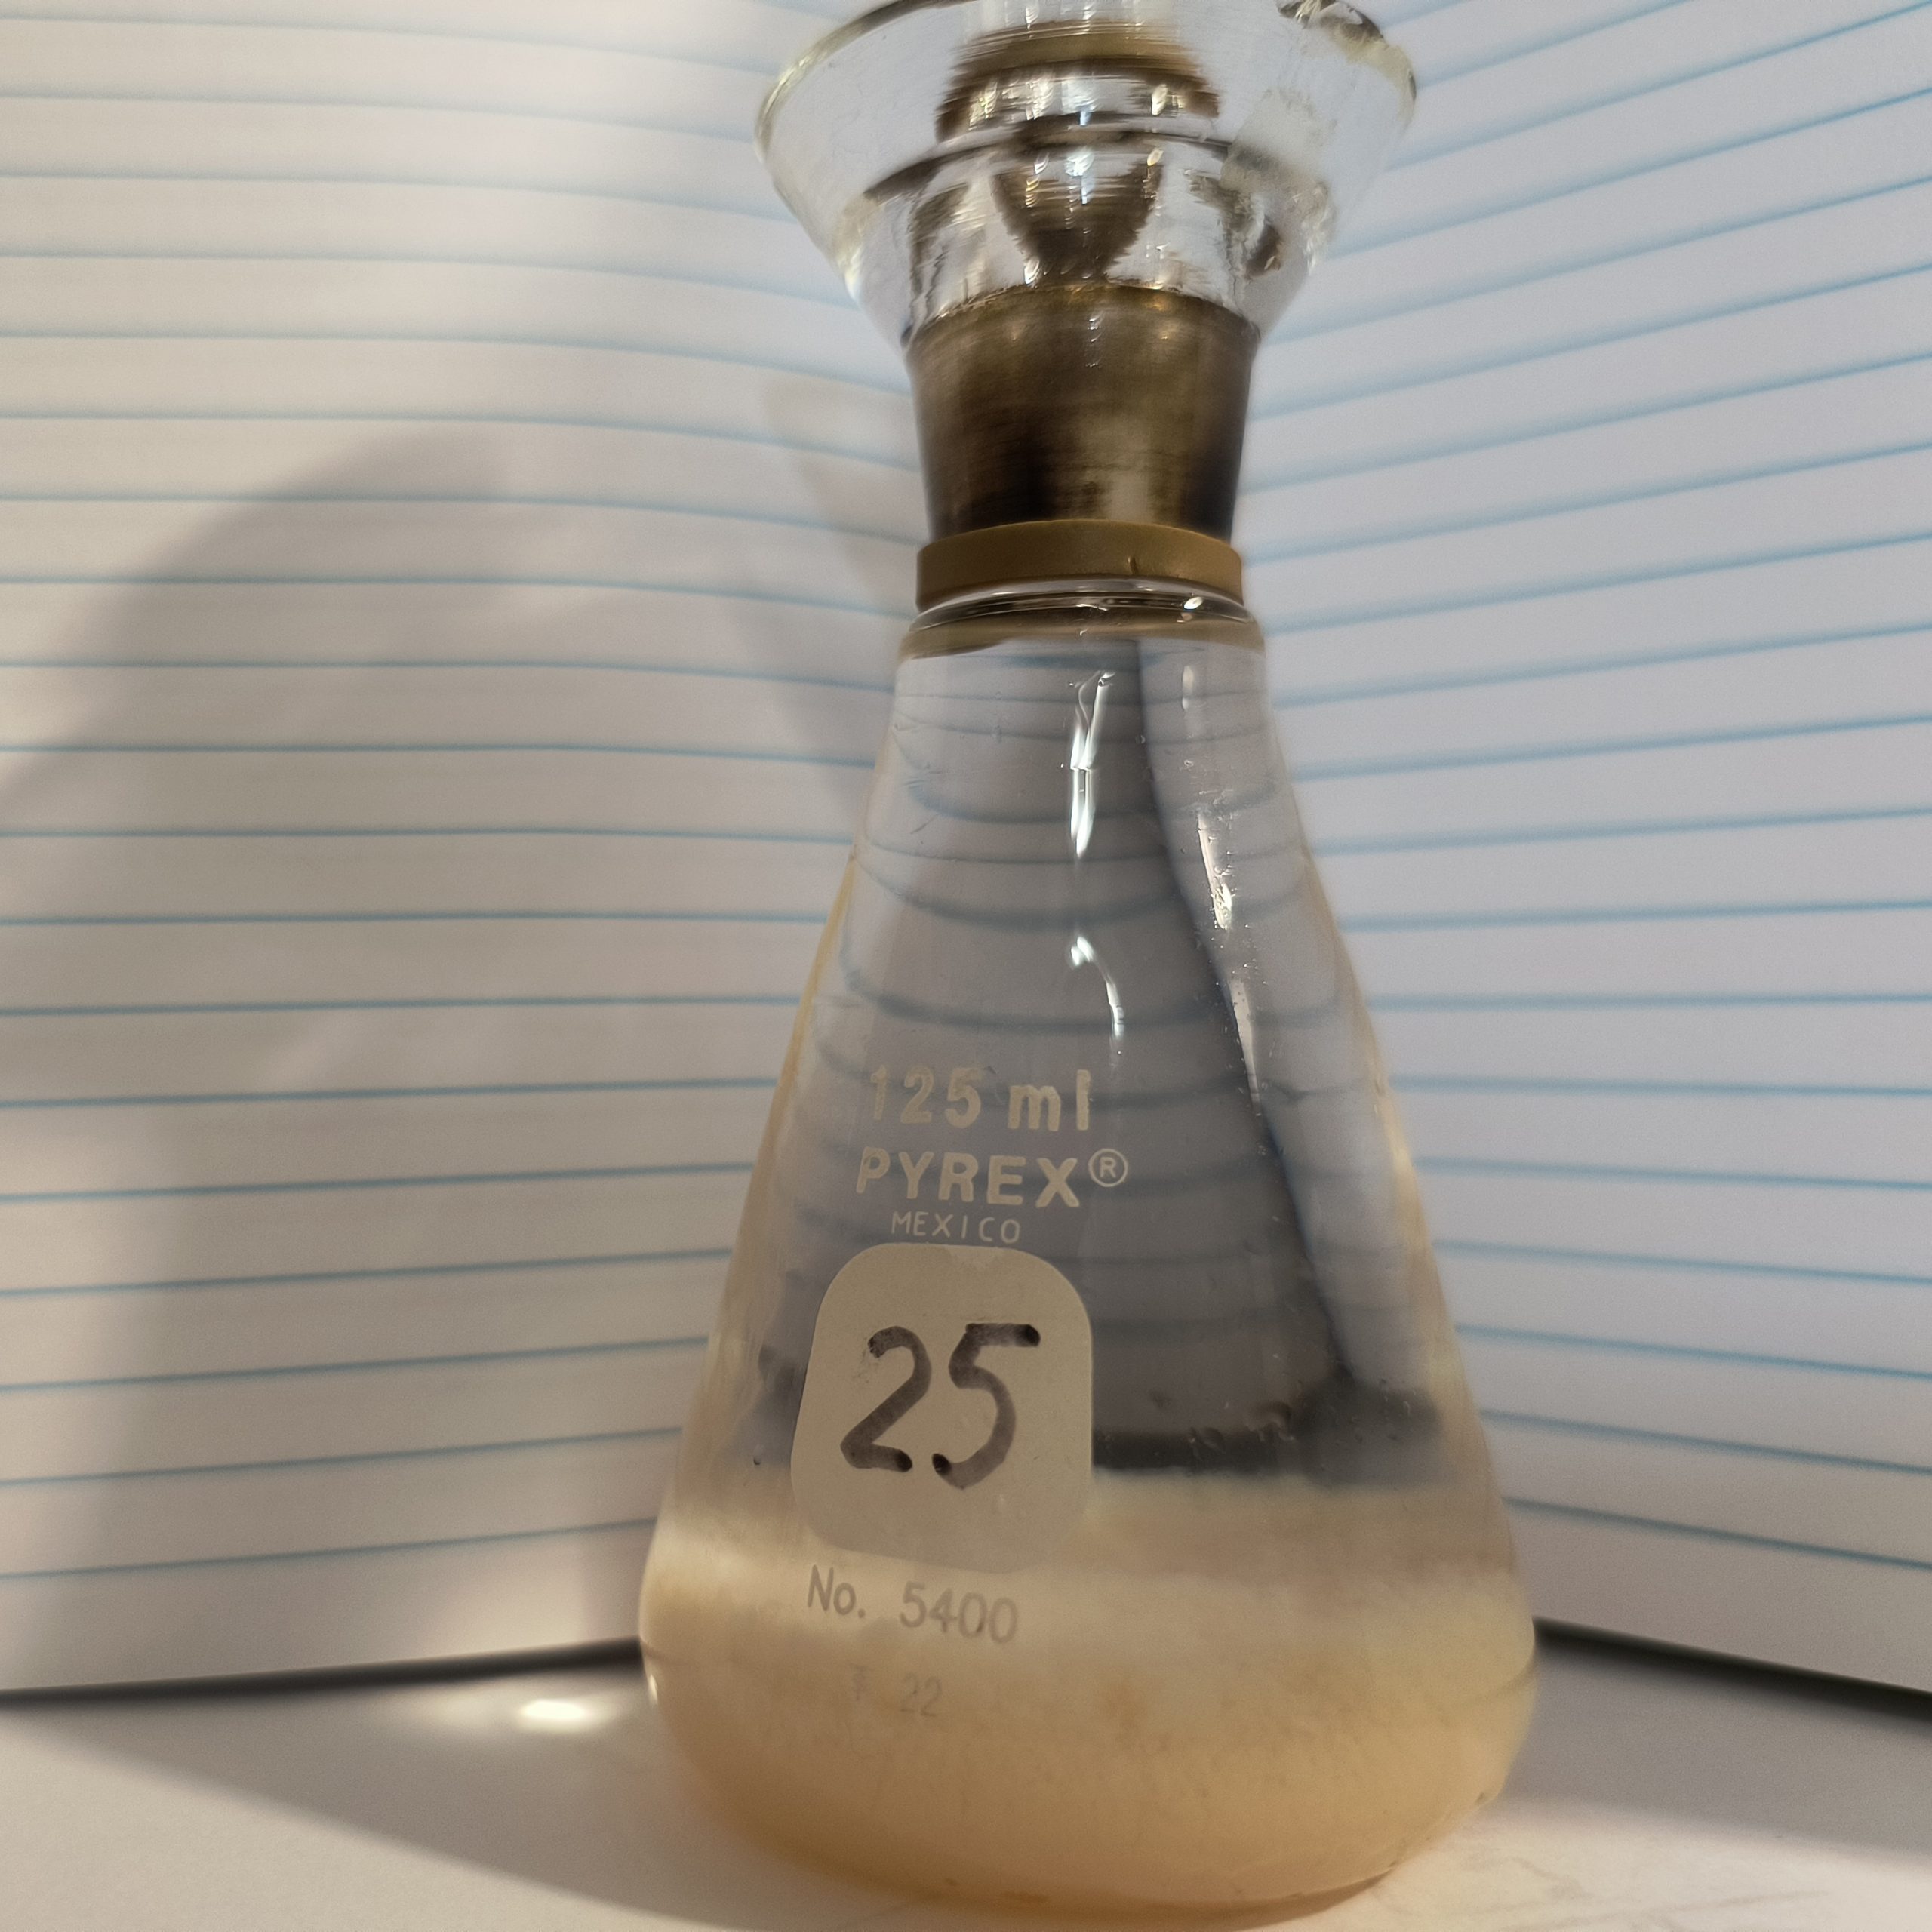
At this point we can sometimes eyeball and guess what the oxygen concentration will be. The next pictures show a low oxygen sample and its precipitate, and a higher oxygen sample and its precipitate.
After the samples have been brought into the lab and allowed to come closer to room temperature, the samples are acidified. Adding sulfuric acid lowers the pH and stops the reaction between manganese chloride and oxygen. It also causes the precipitate to dissolve. In the process the precipitate reacts with the sodium iodide to form iodine. Iodine in solution is yellow. It also conducts electricity. The titrator we use has a detector that measures the amount of electricity, or the current, that flows through the sample. The titrator adds a chemical called thiosulfate that reacts with and consumes the iodine in the sample. The titrator adds the thiosulfate drop by drop and as it does the solution becomes less and less yellow and the current gets closer and closer to zero. When the titrator has added exactly enough thiosulfate to consume all of the iodine in the sample it beeps and displays the volume of thiosulfate that was added. From the volume of thiosulfate added and the weight of water in the flask, the amount of oxygen in the sample can be accurately calculated.
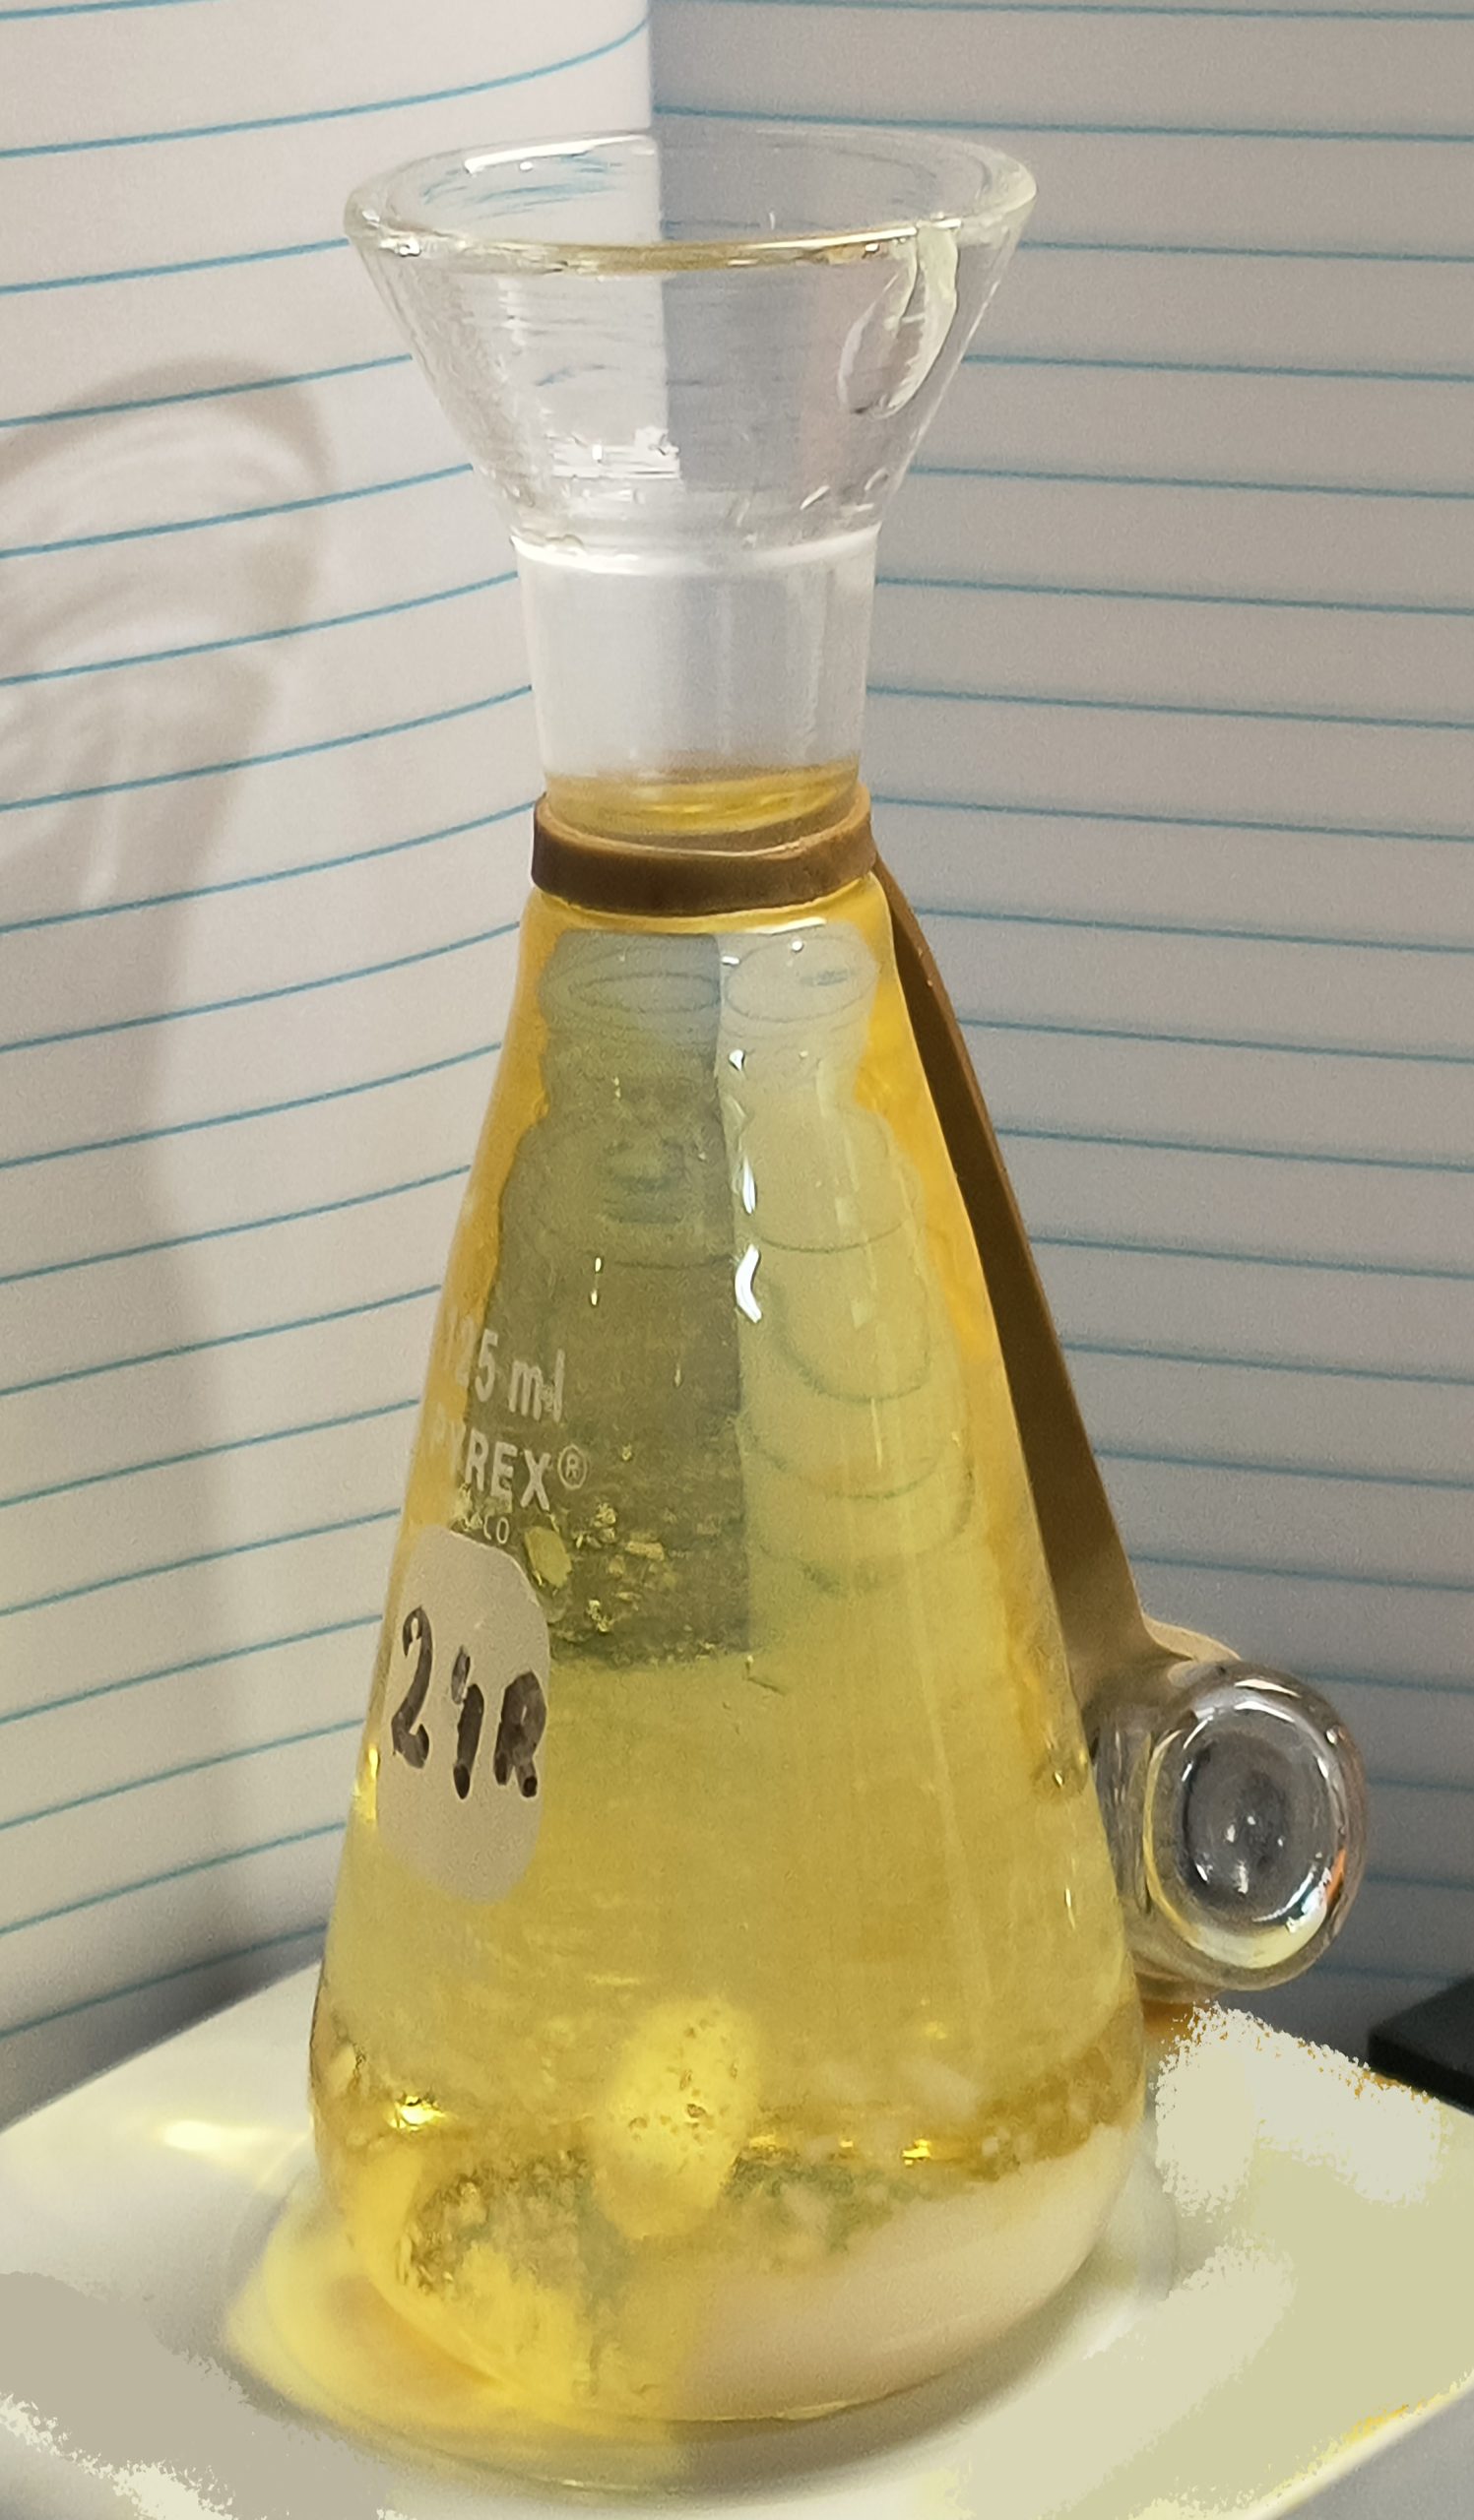
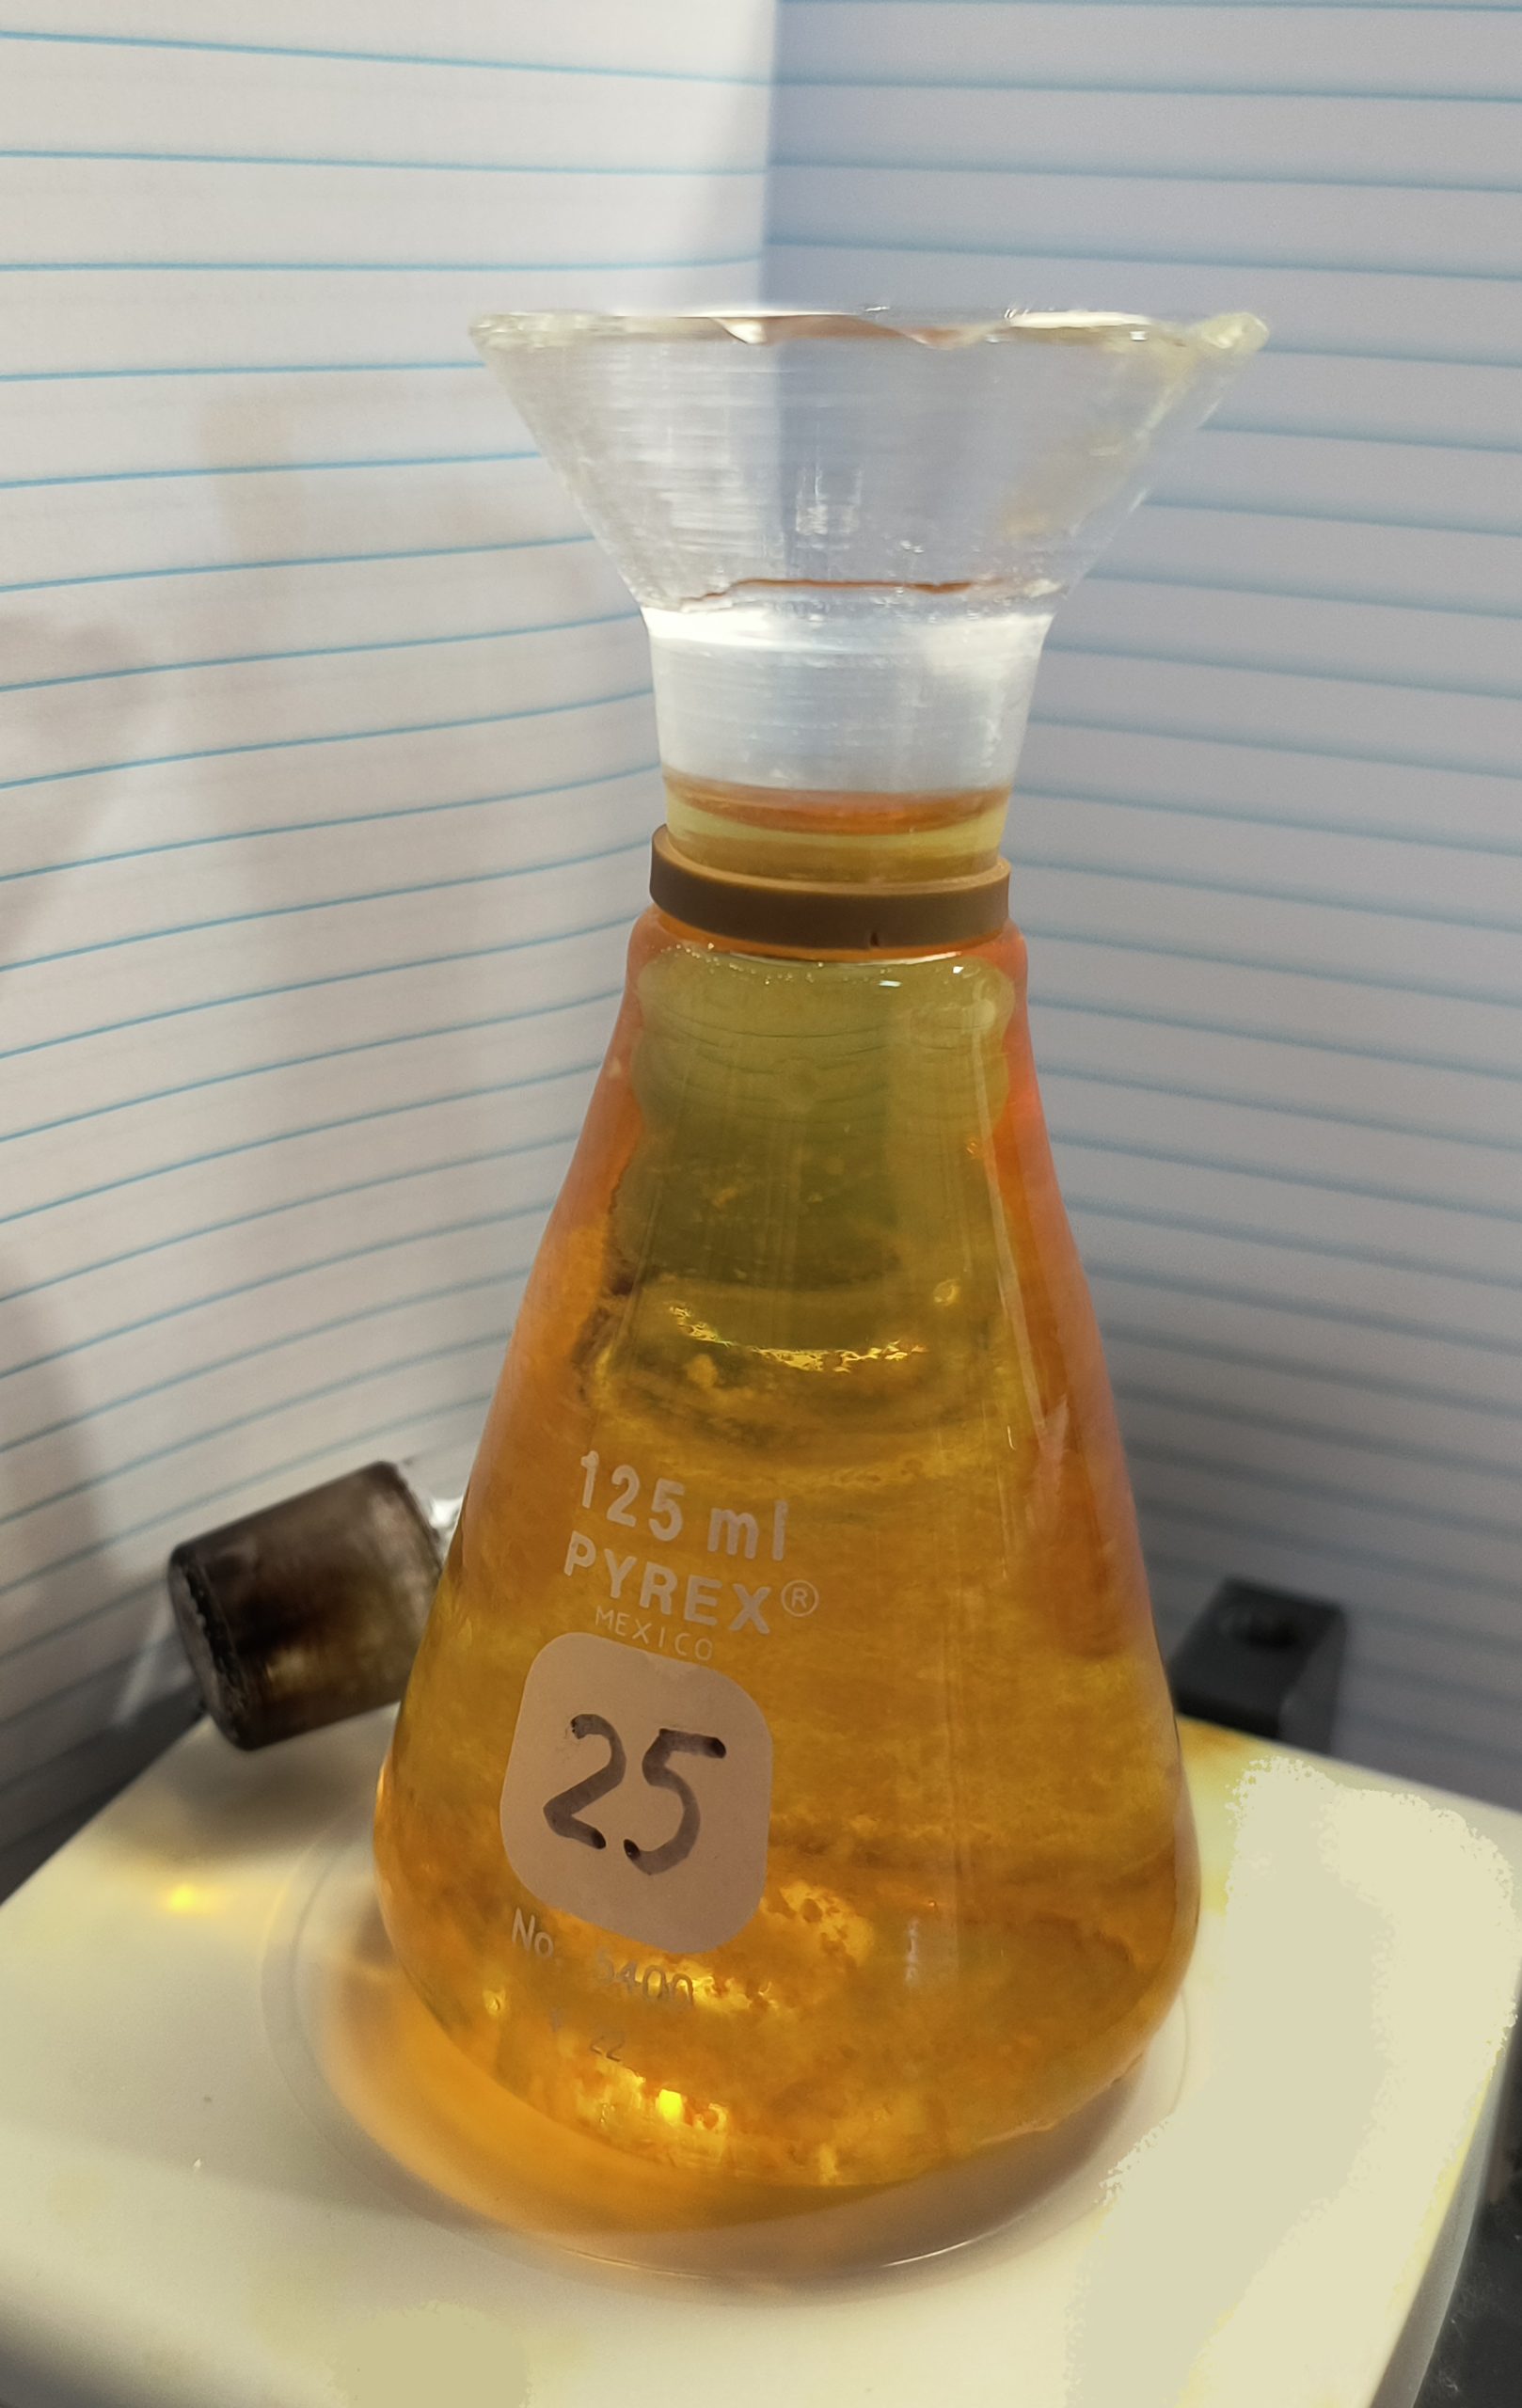
The coolest part of this is when you add the acid, the samples begin to stir, breaking up the precipitate and creating neat formations. This is difficult to demonstrate in a picture, so I will just show the acidified versions of the above two samples described. You can still discern pieces of precipitate and imagine how they may swirl into solution. Congratulations, you’ve now created gold! Well, not real gold. But it has a golden color.
The method requires careful handling and accurate measurement of reagents and samples to ensure reliable results. Error comes into play from burettes (they have to be used properly), ship rolls, and mysterious bubbles. Rinsing sufficiently, minimizing contaminants, and removing all bubbles is crucial in obtaining good samples.
The Winkler method is essential for environmental monitoring and research. It helps assess the health of aquatic ecosystems, where oxygen levels are critical for the survival of fish and other aquatic organisms. It’s also used in aquaculture to ensure water quality and in wastewater treatment plants to monitor the efficiency of treatment processes. In oceanography, it’s a fundamental parameter to continue to monitor, especially when looking at the changes to the planet in the shallow and deep oceans. This is part of GO-SHIP cruises in order to calibrate the real-time sensors on the rosette. Not quite alchemy, since we created and then destroyed our gold, but worth its weight in research value. Many thanks to Dr. Chris Langdon, Professor of Marine Biology and Ecology at the University of Miami Rosenstiel School of Marine, Atmospheric, and Earth Science (UM RSMAS) for his help with this blog.
Jennifer Aicher (University of Miami Rosenstiel School of Marine, Atmospheric, and Earth Science, UM RSMAS) and Rachel Cohn (University of Miami Cooperative Institute for Marine and Atmospheric Sciences (CIMAS). O2 Team, March 11, 2024.
All pictures by Jennifer Aicher unless otherwise noted.

![PIC 4 Jen Adding Reagents Jennifer adding reagents to the water sample. Picture by Teresa Kennedy (UT Tyler/URI)]](https://www.go-bgc.org/wp-content/uploads/2024/03/PIC-4-Jen-adding-reagents-scaled.jpg)
![PIC 5 O2 Sampling Pic By Clara An oxygen sample flask being filled with sea water from the Niskin rosette by Rachel Cohn (UM CIMAS). Picture by Clara Gramazio (UM Rosenstiel School of Marine, Atmospheric, and Earth Science].](https://www.go-bgc.org/wp-content/uploads/2024/03/PIC-5-O2-sampling-pic-by-Clara.jpg)
